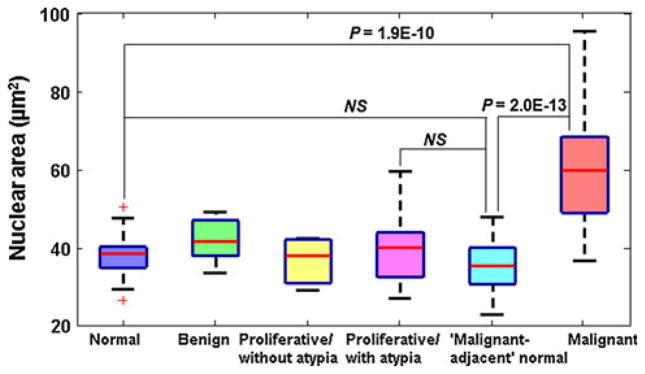
Fig. 4.

Box-and-whisker plots showing the average nuclear area from the 6 categories of breast pathology entities. The average nuclear area of normal cells and “malignant-adjacent” normal cells are not statistically significant (P = 0.2). If P value is 0.1 or larger, “NS” is used
