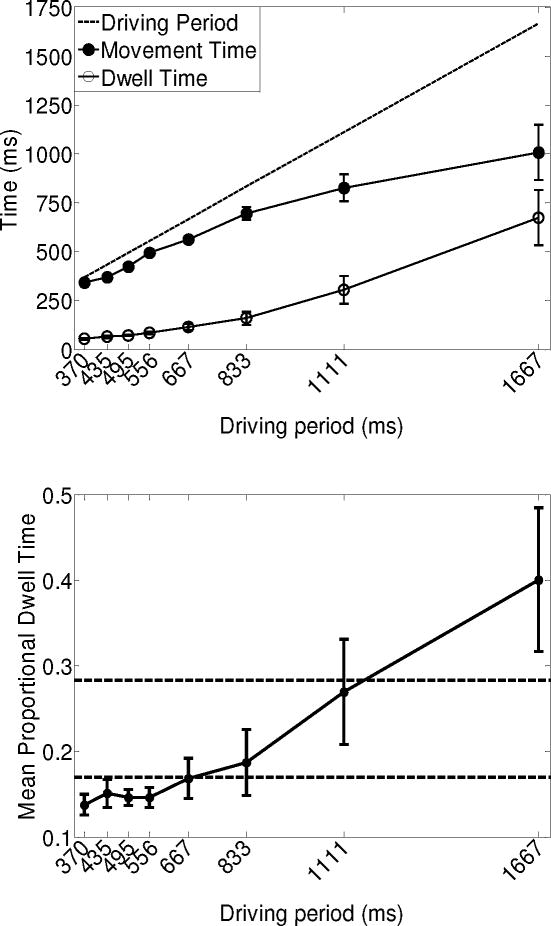
Figure 4.
Top panel: Dwell times (± 1 SE) and movement times (± 1 SE) as a function of driving period. The solid unity line indicates the driving periods generated by the metronome. The dotted horizontal lines indicate mean movement times (± 1 SE) generated when moving in the self-paced trials. Bottom panel: Proportional dwell times (± 1 SE) as a function of driving period. The horizontal lines indicate mean values (± 1 SE) generated when moving in the self-paced trials.

