
Figure 1.
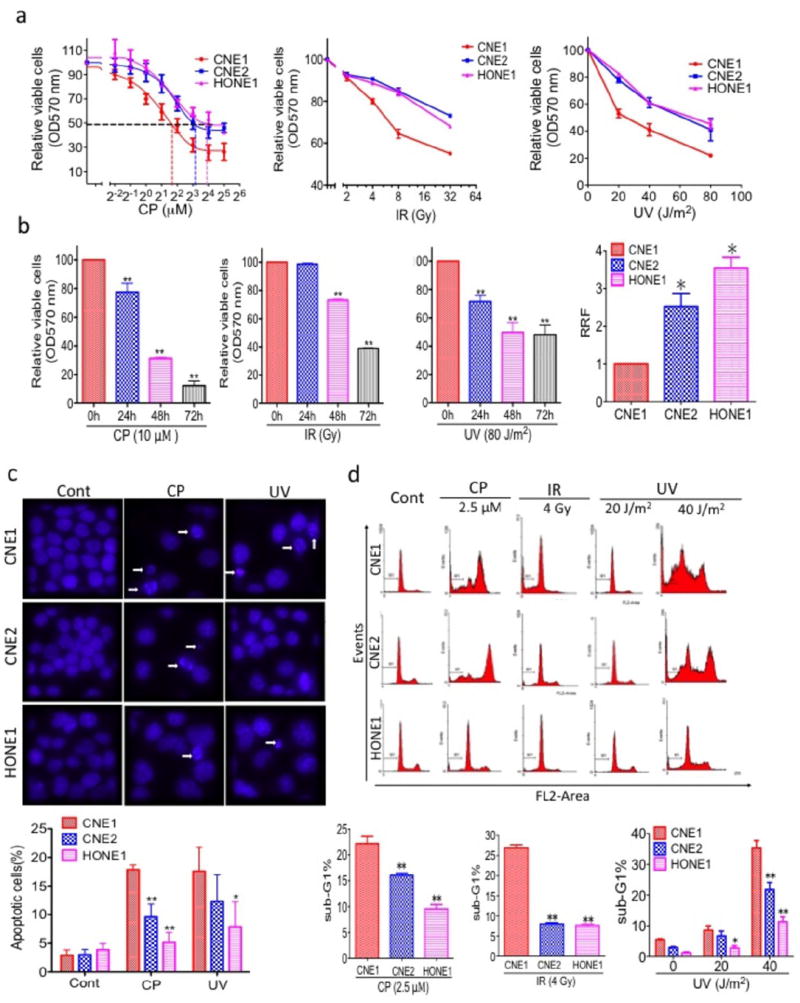
Characterization of NPC cell lines. (a) CNE1, CNE2, and HONE1 cells were treated with various doses of cisplatin (CP, left) or IR (middle) or UV (right) for 48 h. Relative viable cells were measured by the MTT assay, and the relative resistance factors (RRFs) are shown (bottom). (b) Cisplatin, IR and UV inhibit relative viable cells in a time-dependent manner. CNE2 cells were treated with 10 μM CP or 32 Gy IR or 80 J/m2 UV for the indicated times, and relative viable cells was measured by the MTT assay. (c) Apoptosis was measured by Hoechst 33342 staining. (Top) NPC cells were treated with 5 μM CP or 40 J/m2 UV for 72 h, nuclei were stained with Hoechst 33342, and imaging analysis was performed as described in the Materials and Methods. The white arrows indicate apoptotic cells. Original magnification, ×200. (Bottom) Quantification of the cell staining. (d) Measurement of apoptosis by PI staining. (Top) NPC cells were treated with 2.5 μM CP or 4 Gy IR or 20 J/m2 or 40 J/m2 UV for 48 h, followed by PI staining as described in the Materials and Methods. (Bottom) Quantification of PI staining. All data represent three independent experiments, mean ± s.d. *P <0.05, **P <0.01.