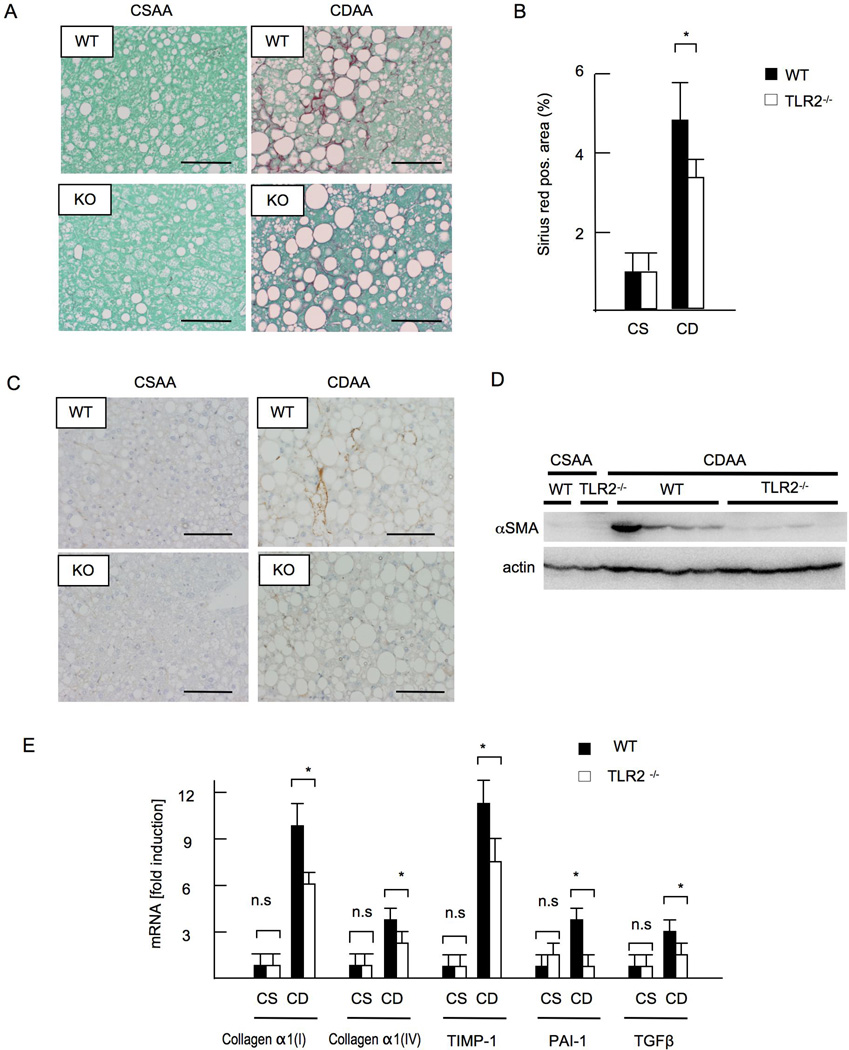
Figure 2. TLR2−/− mice develop less liver fibrosis.
WT and TLR2−/− mice were fed CSAA diet (CS) or CDAA diet (CD) for 22 weeks. Closed bars represent WT mice and open bars indicate TLR2−/− mice. (A) Sirius red staining. Original magnification,×400. Bar 100 µm. (B) Sirius red positive area. Liver fibrosis was attenuated in TLR2−/− mice. (C) Immunohistochemical staining for αSMA. Original magnification,×400. Bar 100 µm. (D) Western blotting for αSMA. (E) mRNA expression of fibrogenic genes. Genes were normalized to 18S RNA as an internal control. Data represent mean ±SD, *p<0.05. n.s.; not significant.

