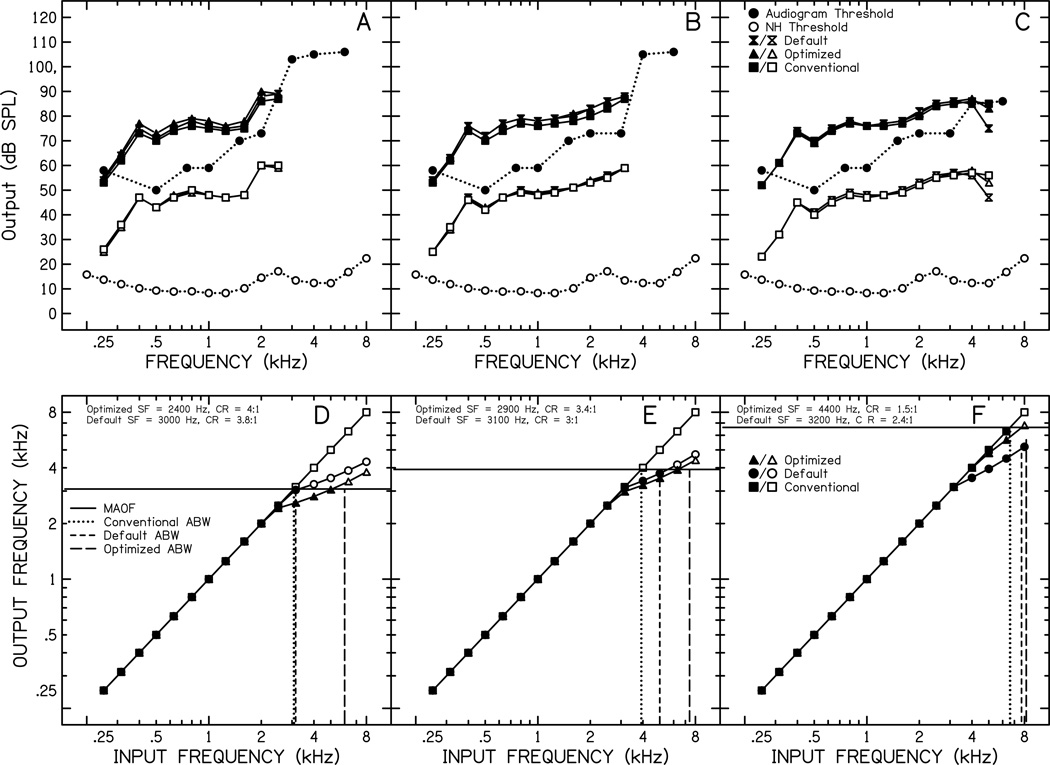
Figure 1.
Output in one-third octave band level in an IEC 711 coupler attached to KEMAR for amplified (filled: hourglass, triangle, square) and normalized (open: hourglass, triangle, square) long-term average speech spectra are shown in panels A–C with each panel corresponding to the same letter audiogram. Thresholds for normal hearing are plotted as open circles and the thresholds for each audiogram are plotted as the filled circles. Panels D-F display the audible bandwidth for each audiogram and condition as frequency input/output functions for each type of processing with filled symbols representing audible frequencies and open symbols representing inaudible frequencies. Differences in the audible bandwidth among the processing types are indicated by the frequency where the vertical lines intersect the horizontal line representing maximum audible output frequency (MAOF). NH = normal hearing; SF = start frequency; CR = compression ratio; ABW = audible bandwidth.

