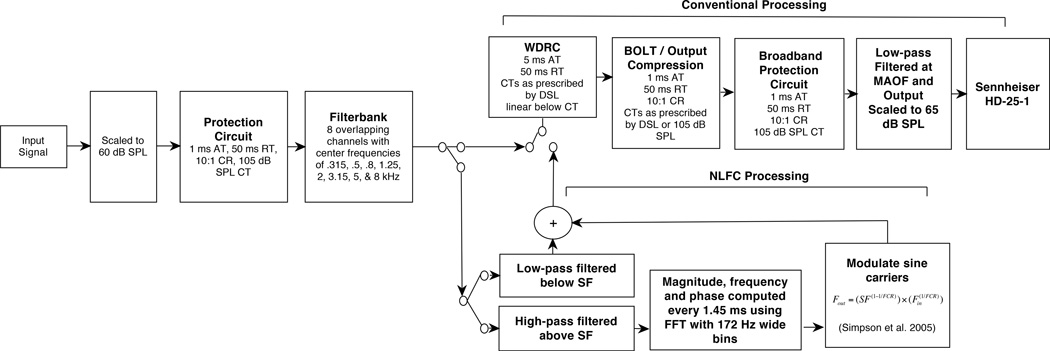
Figure 2.
Hearing aid simulator. Sampling rate was 22050 Hz, compression characteristics were based on the ANSI S3.22-2009 standard, and the equation d (n) = αd (n-1) + (1-α) \x(n)\ if \x(n)\ ≥ d(n-1) else d(n) = βd(n-1) was used to control the gain (Kates 2008), where x(n) is the input signal, d(n)is the output signal, α is the attack time, and β is the release time. If the signal is increasing in level, then the first part of the equation applies otherwise the second part applies. The simulator was programmed to match DSL v5 targets in an IEC 711 coupler attached to KEMAR. Because DSL does not define a target level for the 8 kHz band, a target level was derived that provided the same sensation level as the 6 kHz target. The minimum and maximum gain was limited to 0 and 65 dB, respectively. Frequency compression was applied for the default and optimized conditions using an based onSimpson et al. (2005). Only amplitude compression (WDRC) processing was applied for the conventional condition. AT, attack time; CR, amplitude-compression ratio; CT, compression threshold; FCR, frequency-compression ratio; Fin, input frequency; Fout, output frequency; FFT, Fast-Fourier Transform; RT, release time; SF, start frequency

