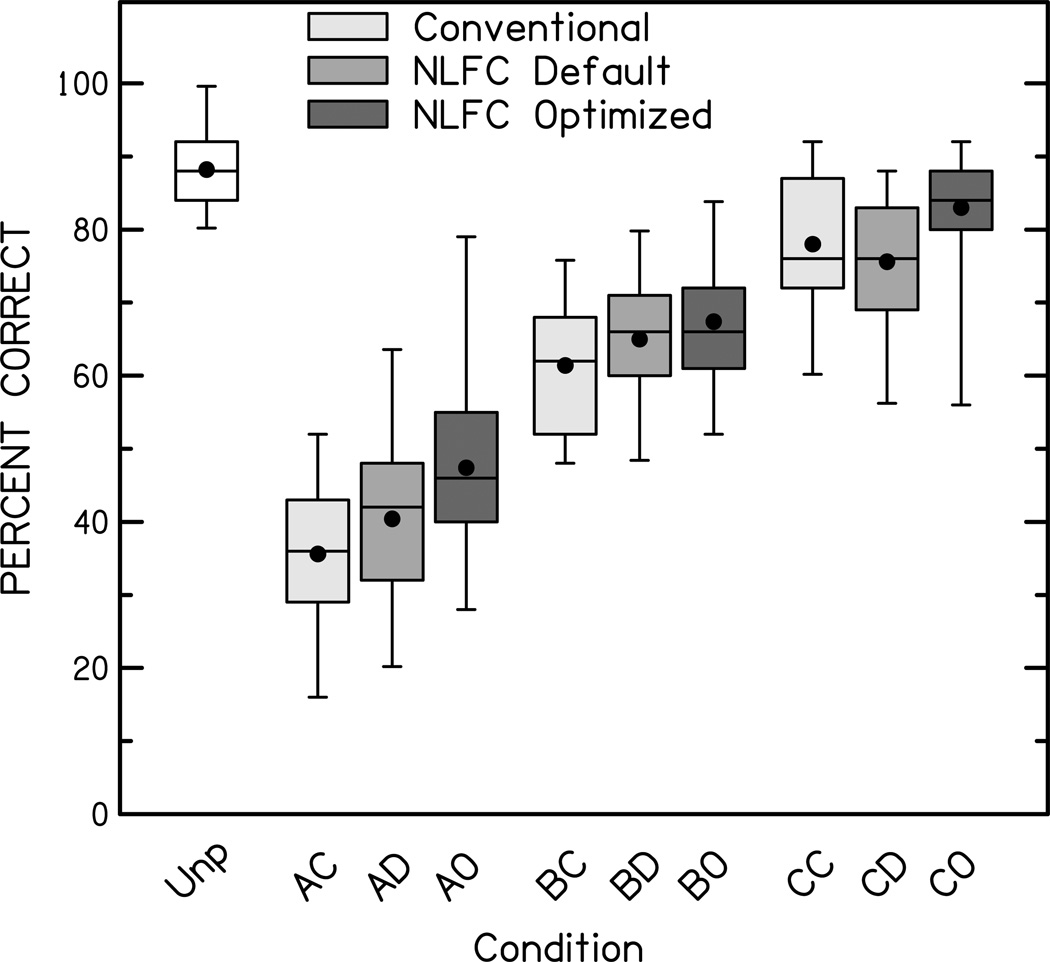
Figure 3.
Percent correct nonword recognition for each condition. Boxes represent the interquartile range (25th – 75th percentile), error bars represent the range of the 5th – 95th percentiles. Medians are plotted as lines within each box. Black circles are means for each condition. Conditions are noted by: Unp = Unprocessed; First letter: A,B,C= Audiogram A,B,C, respectively; Second letter: C=Conventional Processing, D = Default NLFC settings, O = Optimized NLFC settings.

