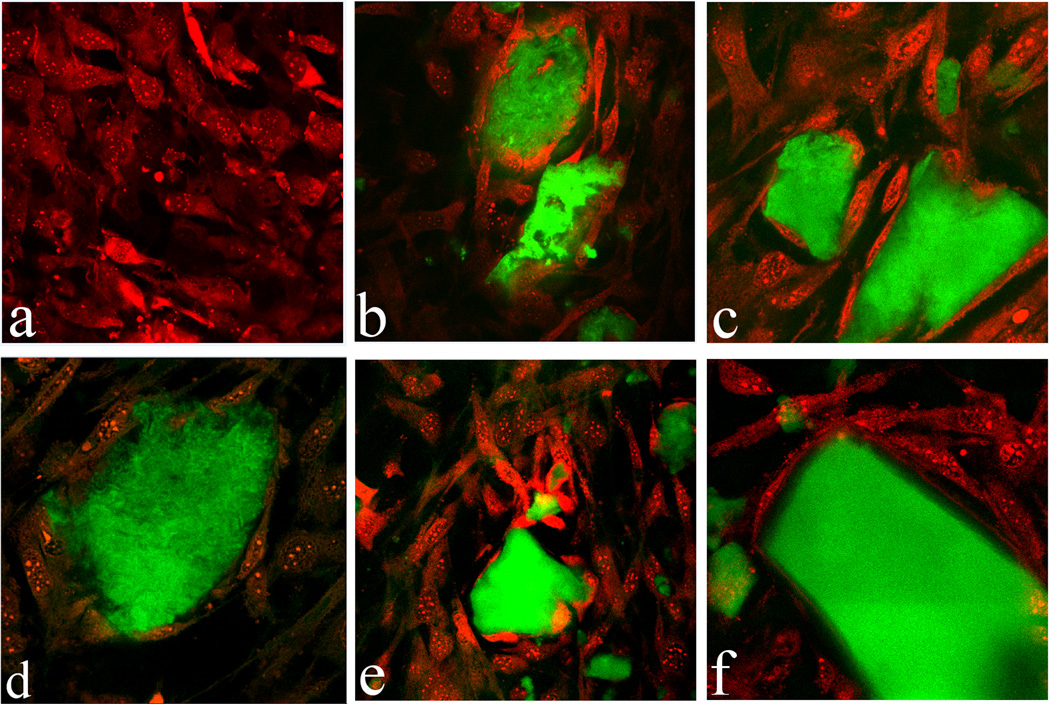
Fig.5.
Single plane confocal optical micrographs of fluorescently stained CAP/CL particles (green) and osteoblastic MC3T3-E1 cells (red) following 7 days of incubation in differentiation medium: (a) control; (b) HAP/CL; (c, d) ACP/CL; (e, f) DCPA/CL; The sizes of the images are 450×450 µm (a, b, d, e) or 270×270 µm (c, f).

