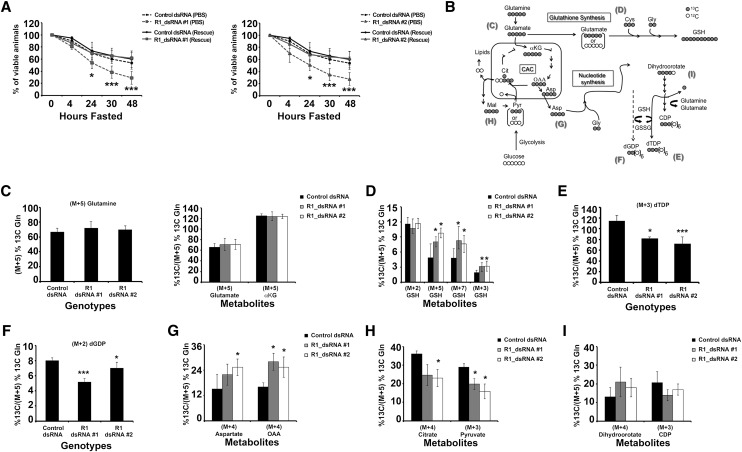
Figure 5.
RBF1-depleted animals' sensitivity to fasting is rescued by glutamine supplementation. Genotypes of animals used are described in the Materials and Methods. Error bars represent the C.I. of 95%. Statistical significance is designated as P-values as follows: (*) P < 0.06; (***) P < 0.001. Statistical differences are between effects from RBF1 depletion compared with control animals. (A) Mid-second instar larvae were fasted or fed only 25 mM L-glutamine over the course of 48 h. (B) Schematic of [U-13C]-glutamine (gray circles) metabolism depicts the expected amount of 13C labeling after glutamine is metabolized through the citric acid cycle (CAC). Molecular symmetry and cellular compartments are not depicted. Unlabeled carbon (12C) is shown by open circles. Molecular symmetry and cellular compartments are not depicted. (αKG) α-Ketoglutarate; (Cit) citrate; (Asp) aspartate; (Mal) malate; (Pyr) pyruvate; (Gly) glycine; (Cys) cysteine; (CDP) cytodine diphosphate; (dTDP) thymidine diphosphate; (dGDP) deoxyguanosine diphosphate. (C–I) Enrichment of the [U-13C5]-glutamine tracer in metabolites associated with glutathione synthesis, the CAC, and nucleotide synthesis. All percentages are relative to the total amount of [U-13C5]-glutamine tracer in each sample.

