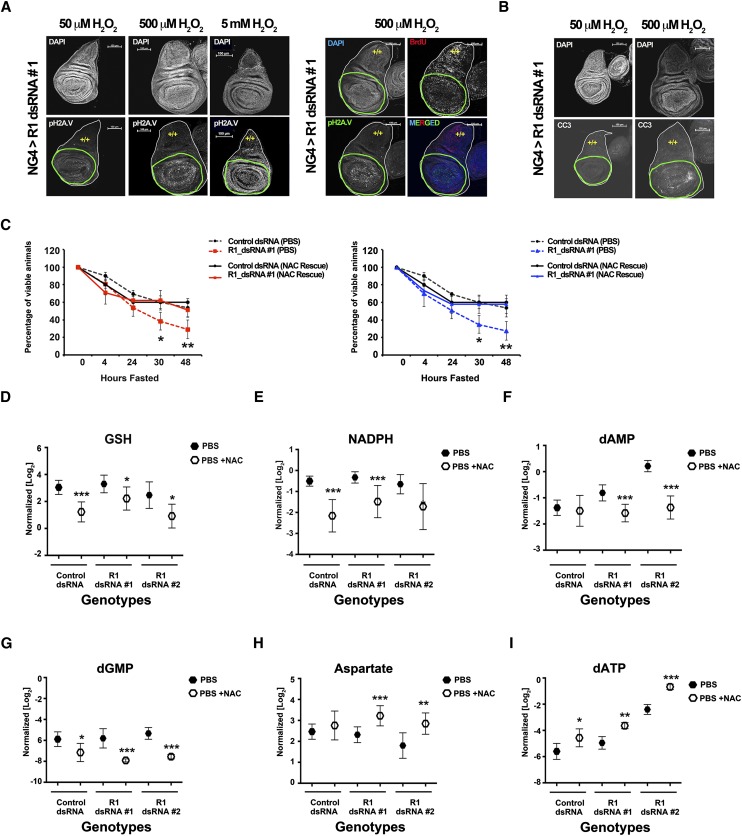
Figure 6.
RBF1-depleted animals' sensitivity to fasting is rescued by NAC supplementation. Genotypes of animals used are described in the Materials and Methods. (A,B) RBF1-depleted cells (green outline) show increased sensitivity to H2O2 when compared with wild-type tissue (yellow +/+). RBF1-depleted cells have increased DNA damage, shown by pH2AV (grayscale and green), but continue to proliferate, shown by BrdU (red). This increased damage leads to increased apoptosis, shown by CC3 (grayscale). Error bars represent the C.I. of 95%. Statistical significance is designated as P-values as follows: (*) P < 0.06; (**) P < 0.02; (***) P < 0.001. Statistical differences are between effects from RBF1 depletion compared with control animals. (C) Mid-second instar larvae were fasted or fed only 0.6 mM NAC over the course of 48 h. (D–I) Normalized metabolite pools from larvae fasted (closed hexagons) or fed 0.6 mM NAC (open hexagons) for 24 h.

