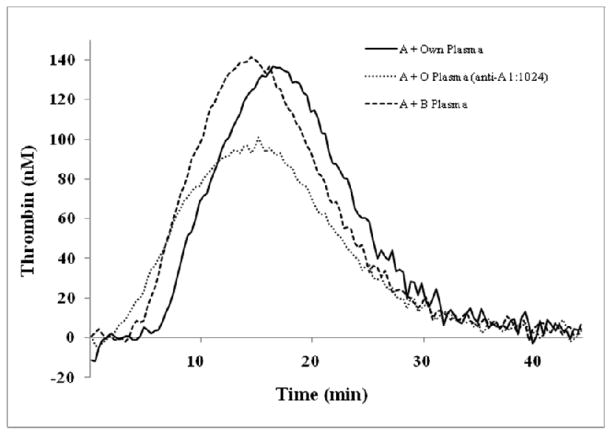
Figure 2.
High anti-A titer O plasma treatment of A platelets significantly reduces the overall thrombin generation. The mean thrombin generation curves of group A platelets (n =11) incubated with either 50 μL of autologous plasma, O plasma with an anti-A titer of 1:1024, or B plasma. Shorter lag times (curves shifting to left) occurred in both the O plasma (dotted line) and B plasma (dashed line) treated samples compared to autologous plasma samples (solid line). Slower time to peak and reduced total thrombin production (endogenous thrombin potential = area under the curve) are seen in O plasma treated samples.

