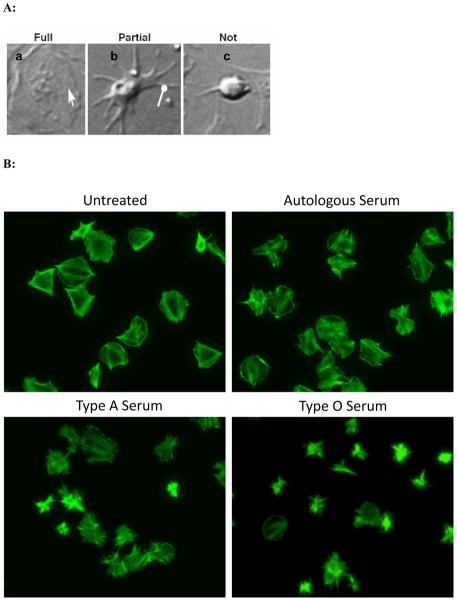
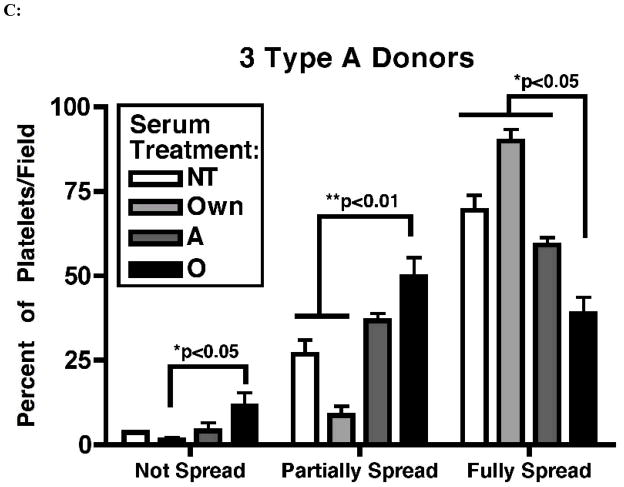
Figure 3.
Anti-A antibodies attenuate platelet spreading. Panel A: Differential interference contrast micrographs demonstrate different stages of platelet spreading that were used as criteria for counting and quantification of platelet spreading. Based on the level of spreading, fully spread platelets were identified by the presence of lamellipodia (pointed arrow) (a); partially spread platelets are indicated by the presence of filopodia (round-headed arrow) but not lamellipodia (b); and platelets that were round and lacked filopodia were considered not spread (c). Panel B: Examples of untreated, autologous serum, A serum, and O serum treated platelets stained with phalloidin-Alexa Fluor 488 which reveals changes in patterns of F-actin fibers (original magnification 100×). Panel C: Quantification of whole images derived from experimental samples using panel A images as a gauge. p values represent comparisons between the corresponding level of spreading in O serum treated group A platelets and non-treated, autologous serum treated, or allogeneic A serum treated group A platelets. These are the statistically significant findings as per level of spreading: not spread, O serum versus own serum (p = 0.034); partially spread: O serum versus own serum (p = 0.016) and versus non-treated (p = 0.001); fully spread: O serum versus own serum (p < 0.001), non-treated (p = 0.004), and versus A serum (p = 0.009).


