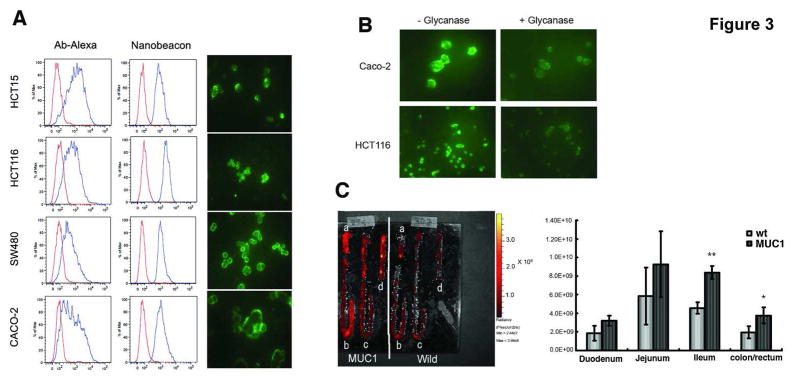
Figure 3.

(A) FACS analysis of TF-associated cell lines after the cells were exposed to either Alexa Fluor-conjugated mAb or the nanobeacon. The red histograms represent isotype control while the blue and shifted histograms indicate labeled cells. For fluorescence microscopy, live cells were incubated with the nanobeacon (4 mg/mL) in a chamber slide for 20 minutes before observation using the FITC channel. Exposure time was 400 ms at a magnification of 400 x each; (B) Specificity of the nanobeacon on human colorectal cancer cells. Treating cells with glycanase resulted in loss of fluorescence signal; (C) Representative fluorescence image captured with IVIS system. After being separated into a) duodenum, b) jejunum, c) ileum and d) colon/rectum and treated with the nanobeacon. ROI photon counts of each part of the intestines were measured by independent experiments in triplicate and represented by mean ± SD. Differences in photon counts were compared using Student’s t-test. *, p<0.05 and **, p<0.01.
