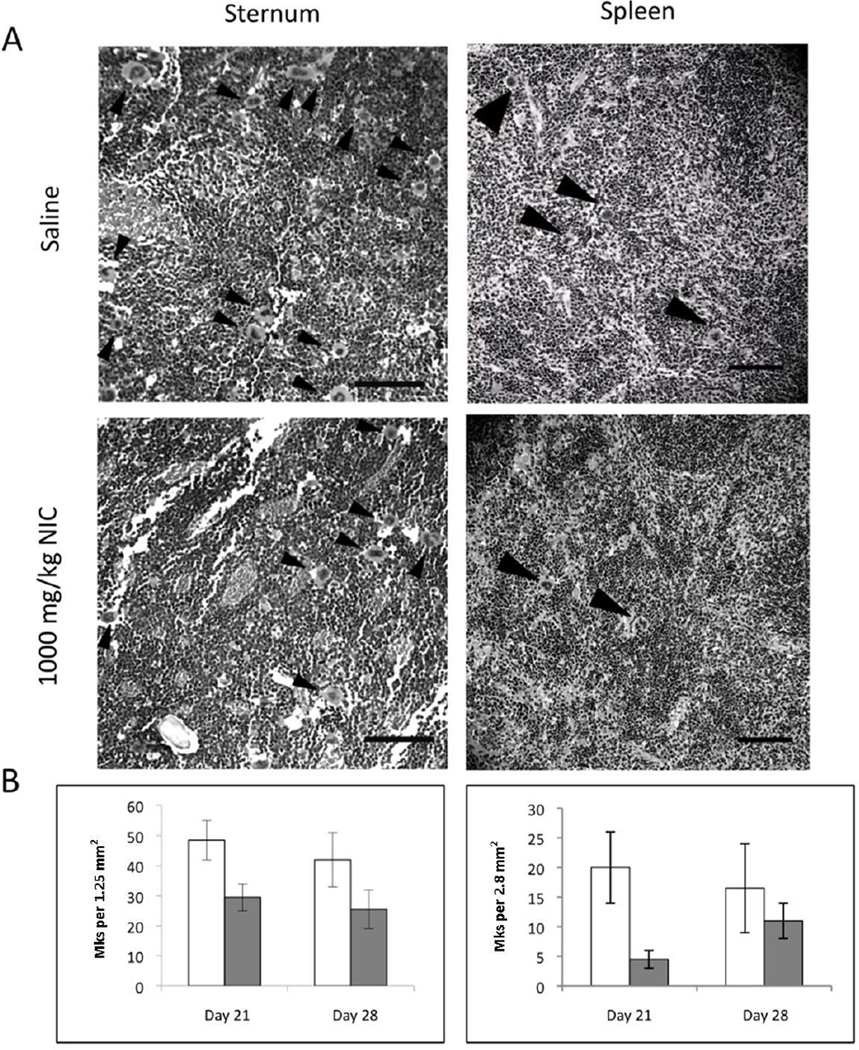
Figure 2.
Numbers of large Mks tended to be lower in sternum and spleen sections of NIC-treated mice. (A) Representative black and white images of H&E-stained histological sections showing Mk density and distribution within sternum (day 21; left panels) and spleen (day 28; right panels) tissues taken from mice treated daily with saline or 1000 mg/kg NIC. Polyploid Mks were identified based on their large size, and are indicated by arrowheads. (B) Graphs represent Mks quantified from H&E-stained samples from mice treated daily with saline (open bars) or 1000 mg/kg NIC (gray bars) and sacrificed on days 21 and 28. Total Mks were quantified in viewing areas of 1.25 mm2 and 2.8 mm2 for sterna and spleens respectively. Values represent the mean ± SEM of two sections. Scale bars represent 0.1 mm.

