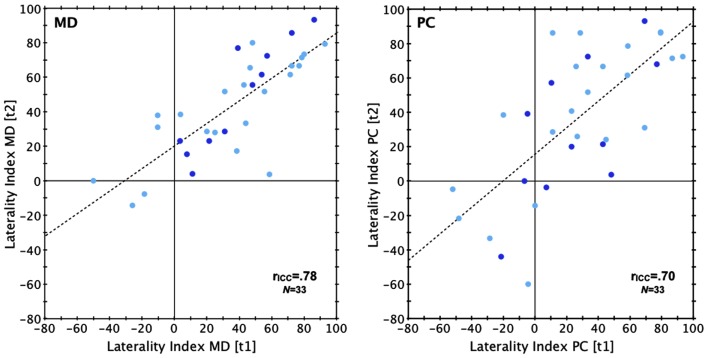
Figure 1.
Reliability (Norwegian sample). Scatterplot depicting intraclass correlations between results at test run 1 (t1) and test run 2 (t2; left: MD version; right: PC version). Laterality index, percentage difference between correct LE and RE reports. rICC, intraclass correlation coefficient. Dot color indicates sex: light blue, females; dark blue, males.

