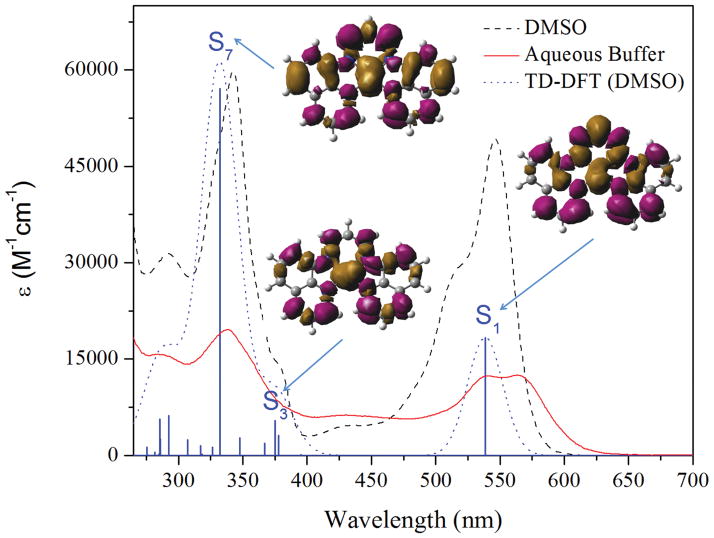
Fig. 2.
UV-vis spectra of [Pt(BDIQQ)]Cl in DMSO (black, dashed) and aqueous buffer (red, solid, pH 7.4, 10 mM Tris, 10 mM NaCl). The dotted blue line is the simulated UV-vis spectrum from TD-DFT calculations with a DMSO solvation model. The solid blue bars represent individual singlet transitions, and the associated EDDMs for selected transitions are displayed.

