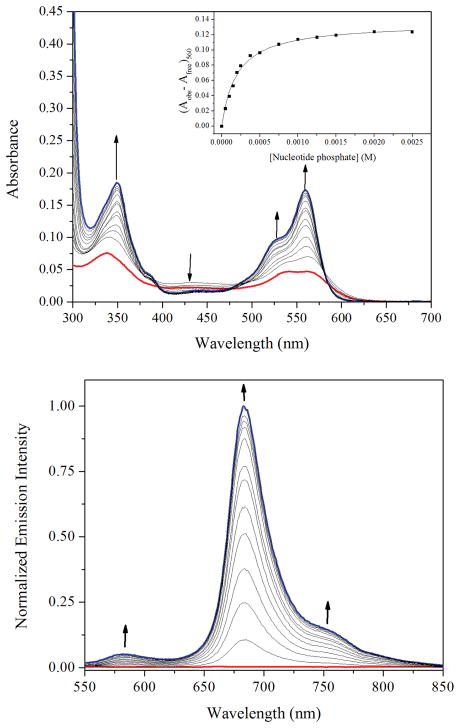
Fig. 3.
UV-vis (top) and emission (bottom) spectral changes of [Pt(BDIQQ)]Cl upon the addition of up to 500 equiv. nucleotide of CT-DNA in buffer (pH 7.4, 10 mM Tris, 10 mM NaCl) after a 16 h equilibration period. The black arrows mark the spectral changes as the concentration of CT-DNA increases. The inset shows a plot of [DNA] vs. absorbance at 560 nm.

