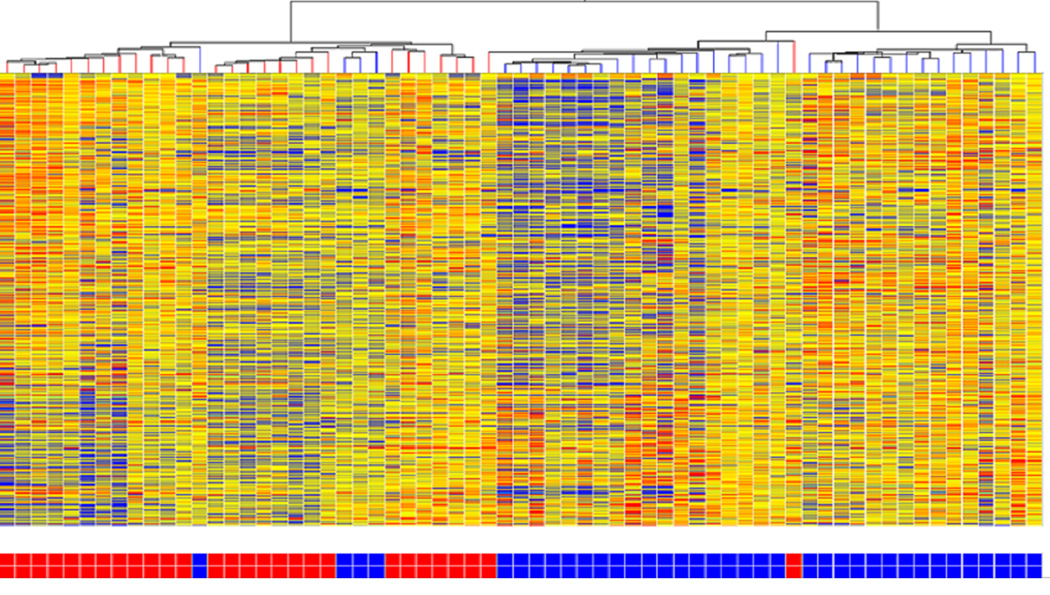
Figure 1.
Hierarchical cluster analysis of expression patterns of all genes expressed at a significantly different level between Epilepsy (Partial and Generalized) and Controls. Epilepsy subjects are represented by blue boxes at the bottom of the figure and controls by red boxes. There is evident clustering of epilepsy subjects. Individual subjects are represented in each column. Individual probesets are represented by each row. Hierarchical cluster analysis groups subjects and probesets that are most alike together and presented as a branching pattern of subjects (top) and probesets (left). Subjects within the same branch are the most similar. For individual probesets, red indicates that the probeset is expressed at a higher level of expression than the average expression for that probeset, while blue represents a lower level of expression.

