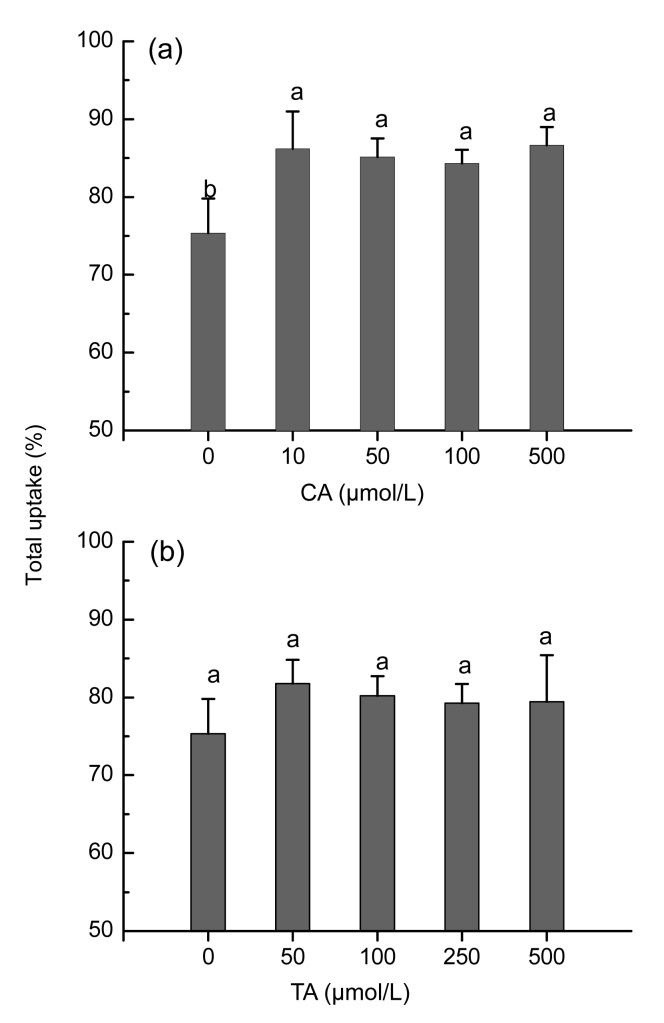
Fig. 3.
Effects of CA (a) or TA (b) on the percentage distribution of 109Cd to shoots of Sedum alfredii
Plants were exposed to 100 μmol/L 109Cd in nutrition solution for 24 h, with addition of different levels of CA or TA. Data points and error bars represent means and SEs of three replicates. Different letters indicate significant difference between different treatments at P<0.05

