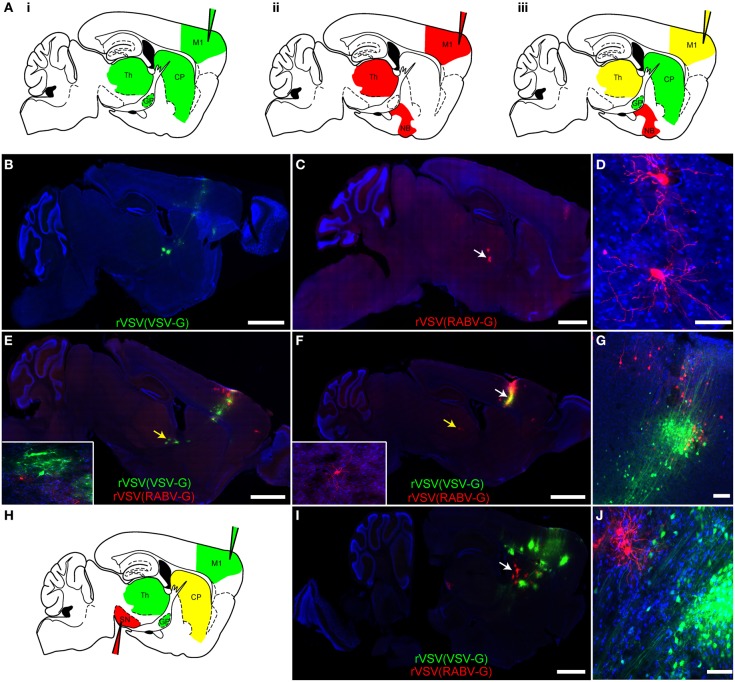
Figure 6.
Simultaneous anterograde and retrograde transsynaptic circuit tracing using rVSV. (A) Connectivity schematics of parasaggital sections indicating patterns of spread from injection of M1 (injection needles) with a polysynaptic virus transmitting across synapses in the (i) anterograde or (ii) retrograde directions. Panel (iii) shows the pattern from co-injection of two polysynaptic viruses, one anterograde and one retrograde. Green represents the anterograde virus, red the retrograde virus, and yellow, both. Note that yellow indicates that the area is predicted to host infection by both viruses, with potentially some individual cells showing infection with both viruses. (B) The anterograde transsynaptic virus rVSV(VSV-G), when injected alone, labeled M1 as well as anterograde projection areas, such as the CP, GP, and thalamus, whereas (C) the retrograde virus rVSV(RABV-G) labeled M1 as well as areas projecting to the cortex, including the thalamus. (D) High magnification of thalamic cells shown in (C) (white arrow). (E,F) Examples taken from a series of parasaggital sections from the same brain of an animal injected with both viruses simultaneously into M1. Co-infection of cells in M1 was not observed, (G), and no spurious labeling of anterograde or retrograde projection regions was observed—i.e., the combination of viruses was equal to the sum of each virus injected individually. Insets show high magnifications of thalamic neurons in (E) and (F) labeled by the two viruses (indicated by the yellow arrows) demonstrating no co-labeling. (G) A high magnification view of the injection site in the cortex shown in panel (F) (white arrow), showing independent labeling of neurons by each virus. (H) A schematic of a parasaggital section depicting the pattern of transmission of an anterograde (green) and retrograde (red) virus injected into two different areas of the basal ganglia circuit. This strategy can be used to connect multiple elements in a circuit. The rVSV(VSV-G) that expressed Venus (labeled cells depicted in green) was injected into M1, while the rVSV(RABV-G) that expressed mCherry was injected into the SN, where it labeled direct pathway MSNs in the CP (yellow). (I) Using these coordinates, largely non-overlapping regions of the CP were labeled by these viruses, as shown in (J). Scale bars: (B,C,E,F,I) = 1 mm; (D,G,J) = 50 μm.

