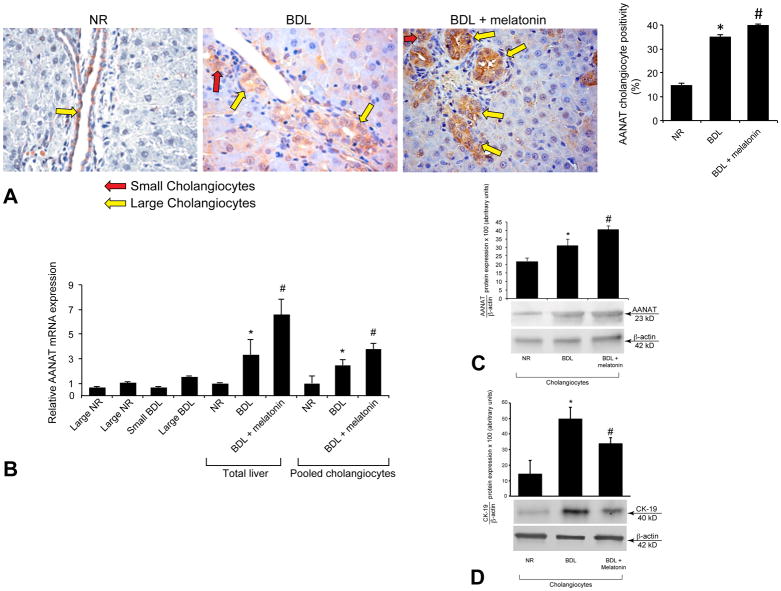
Figure 1.
[A] By immunohistochemistry, AANAT was expressed by both small (red arrows) and large (yellow arrows) bile ducts from normal and BDL rats. AANAT expression increased in bile ducts from BDL compared to normal rats, and in BDL rats treated with melatonin compared to BDL rats. Values are obtained from the immunohistochemical evaluation of 10 randomly selected fields of 3 slides obtained from 3 rats for each group. *p<0.05 vs. the corresponding value of normal rats. #p<0.05 vs. the value of BDL rats. Orig. magn. x40. [B] By real-time PCR, AANAT was expressed by total liver, pooled, small and large cholangiocytes from normal and BDL rats. [B–C] By real-time PCR and/or immunoblots, AANAT expression increased in total liver and pooled cholangiocytes from BDL rats compared to normal rats, and from BDL rats treated with melatonin compared to BDL rats. [B] Data are mean ± SEM of six real-time reactions performed in cumulative preparations (due to the low cell yield from 1 rat) of cholangiocytes obtained from 6 rats. [C] Data are mean ± SEM of six immunoblots performed in cumulative preparations of cholangiocytes obtained from 6 rats. *p<0.05 vs. the values of normal rats. #p<0.05 vs. the value of BDL rats. [D] CK-19 expression increased in cholangiocytes from BDL compared to normal rats, and decreased in BDL rats treated with melatonin compared to BDL rats. Data are mean ± SEM of six immunoblots performed in cumulative preparations of cholangiocytes obtained from 6 rats. *p<0.05 vs. the corresponding value of normal rats. #p<0.05 vs. the value of BDL rats.

