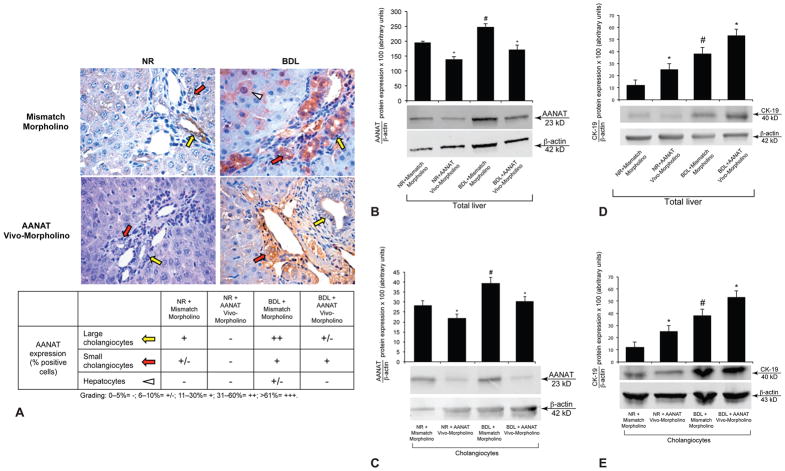
Figure 2.
[A] AANAT was expressed by both small (red arrows) and large (yellow arrows) bile ducts from normal and BDL rats. [A–C] AANAT protein expression decreased in bile ducts (in liver sections), total liver samples and cholangiocytes from both normal and BDL rats treated with AANAT Vivo-Morpholino compared to controls. [A] Orig. magn. x40. Values are obtained from the immunohistochemical evaluation of 10 randomly selected fields of 3 slides from 3 rats for each group. [B] Data are mean ± SEM of 6 immunoblots performed in 3 different total liver samples obtained from 6 individual rats. [C] Data are mean ± SEM of 6 immunoblots performed in in cumulative preparations of cholangiocytes obtained from 6 rats. *p<0.05 vs. the corresponding value of rats treated with mismatch Morpholino. #p<0.05 vs. the corresponding value of normal rats. [D–E] CK-19 protein expression increased in total liver and cholangiocytes from normal and BDL rats treated with AANAT Vivo-Morpholino compared to controls. [D] Data are mean ± SEM of 6 immunoblots performed in 3 different total liver samples obtained from 6 individual rats. [E] Data are mean ± SEM of 6 immunoblots performed in cumulative preparations of cholangiocytes obtained from 6 rats. *p<0.05 vs. the corresponding value of rats treated with mismatch Morpholino. #p<0.05 vs. the corresponding value of normal rats.

