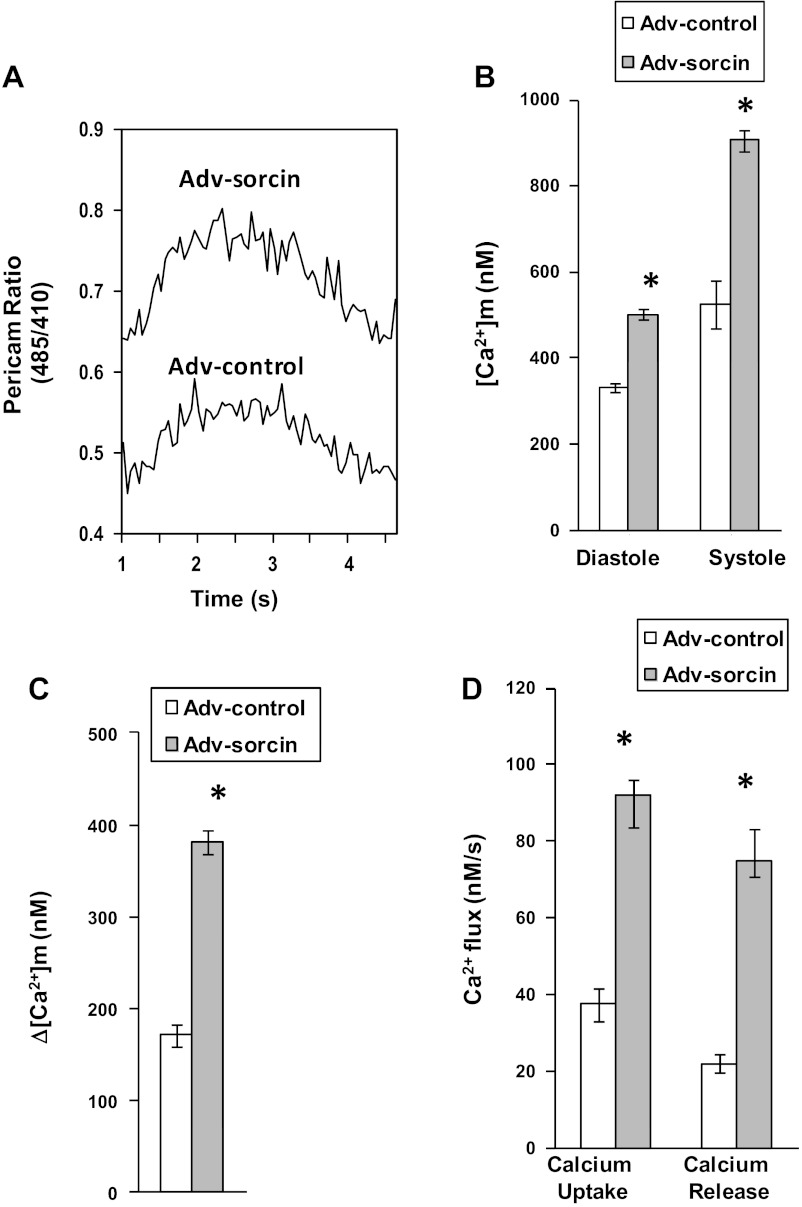
Fig. 2.
Analysis of mitochondrial Ca2+ transients of sorcin-overexpressing cells. A: typical recording of Ca2+ transients from a cell infected with Adv-control and a cell infected with Adv-sorcin. B: cumulative diastolic and systolic mitochondrial Ca2+ concentrations ([Ca2+]m) in control and sorcin-overexpressing cells. C: magnitude of the Ca2+ transient (difference between diastolic and systolic Ca2+). D: effect of sorcin on mitochondrial Ca2+ uptake and release. Values are means ± SE, n = 20 cells per group. *P < 0.05 vs. control.

