
Figure 4.
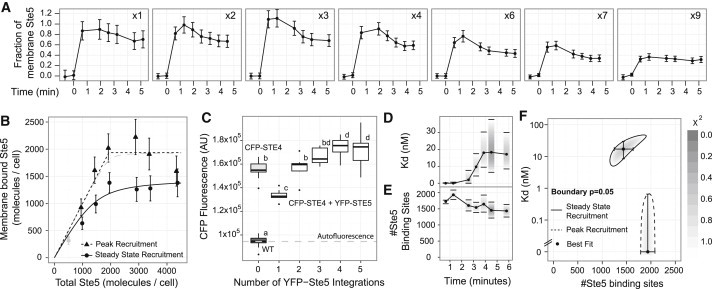
Measurement of effective binding affinity. (A) Membrane recruitment dynamics for strains with the indicated integration number of the PSTE5-YFP-STE5 construct. Error bars represent the 95% CIs for the mean plus the calibration uncertainty (see Supporting Material for details). (B) Bound amount of YFP-Ste5 versus total amount of YFP-Ste5, assuming a concentration of 484 molecules of YFP-Ste5 per integration, considering the recruitment at 4 min (circles) or the maximal level (triangles). The solid line is the best fit of a bimolecular association model for the recruitment level at 5 min, resulting in Kd = 17 ± 9 nM. For the peak recruitment level, only an upper bound for Kd = 0.65 nM (gray dashed line) can be determined, because the best fit results in a Kd of zero (black pointed line). (C) Mean CFP-STE4 membrane fluorescence for different strains, ordered by YFP-STE5 integration number. For each strain, nine images were acquired. The box-whisker represents the distribution of the averages of all cells within an image, the thick black line represents the median, and box boundaries represent the first and third quantiles. Whiskers extend to the most extreme value within 1.5 times the interquantile range, measured from the box boundary. Shared letters (a–d) between two strains indicate nonsignificant differences as computed by Tukey’s honest significance difference test, with α = 0.05. The dashed gray line represents the autofluorescence level. (D) Time evolution of Kd. The best fit of the bimolecular association model at each time is marked with a dot. The horizontal lines correspond to the 95% CI of the Kd. The bars are shaded according to the χ2 cost of the fit for the corresponding value of Kd (see Supporting Material for details). (E) Evolution of the total amount of Ste5 binding sites. Dots, lines, and bars as in panel D. (F) Regions of acceptable model parameters (Kd and number of Ste5 binding sites), for the SS (solid line) and peak (dashed line) recruitment. The area within these regions is shaded according to the χ2 cost of the fit. The dots represent the best fits, and the error bars indicate the 95% CIs as presented in D and E.