
Figure 1.
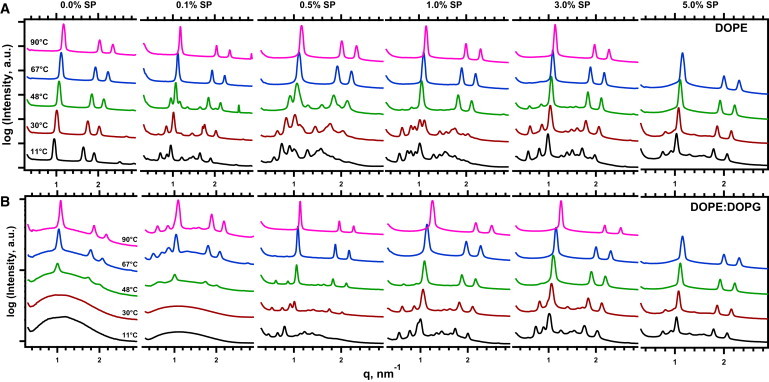
Diffraction from phospholipid-protein mixtures. Traces depict radially integrated intensity plotted on a logarithmic scale for a limited range of q. The different sets of data are offset vertically without change in scale to allow inspection of the separated traces. The results show how DOPG, different levels of SP (%, w/w), and temperature affect diffraction from DOPE. Data at additional temperatures and concentrations of protein were omitted for clarity of presentation. Samples contain 2 μM EDTA and 10 mM HEPES, pH 7.0. (A) DOPE alone. (B) DOPE/DOPG (9:1, mol/mol).