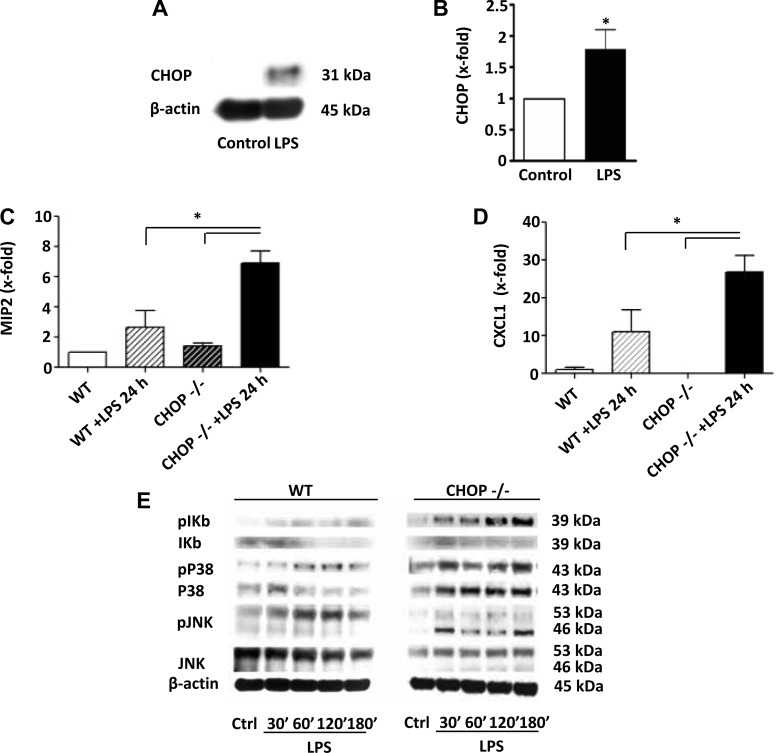
Fig. 10.
Exaggerated inflammatory response in CHOP−/− podocytes after LPS treatment. Podocytes were grown from CHOP−/− and WT glomeruli. RNA and protein were isolated from podocytes treated with LPS and untreated controls. A: representative Western blot image showing LPS-induced increase in CHOP protein levels in podocytes from WT mice. B: qRT-PCR. CHOP mRNA expression was significantly increased in WT podocytes after LPS stimulation (*P < 0.05). C: qRT-PCR. MIP2 mRNA levels were 2.6-fold higher in CHOP−/− podocytes than in WT podocytes after LPS stimulation (*P < 0.05). D: qRT-PCR. CXCL1 mRNA levels were 2.4-fold higher in CHOP −/− podocytes compared with WT podocytes after LPS stimulation (*P < 0.05). E: WT and CHOP−/− podocytes were treated with LPS for 0, 30, 60, 120, and 180 min and proteins were collected. Representative gels showing a stronger IκB phosphorylation in response to LPS stimulation in podocytes isolated from CHOP−/− mice compared with podocytes isolated from WT mice. CHOP−/− podocytes also showed a stronger LPS-induced p38 phosphorylation. Data are expressed as means ± SD.

