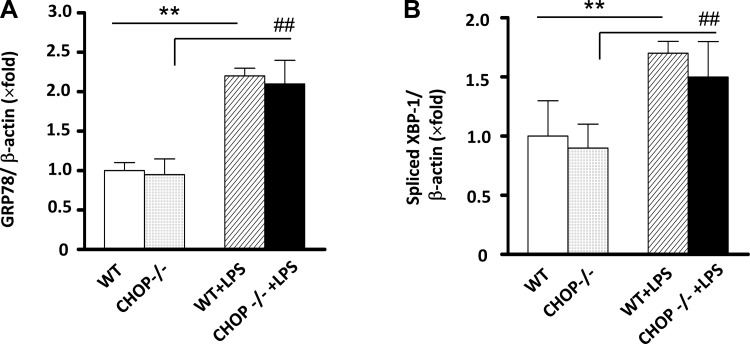
Fig. 2.
LPS induces comparable ER stress activation in WT and CHOP−/− mice. mRNA levels of GRP78 (A) and spliced XBP-1 (B) were determined in kidneys from WT controls, LPS-treated WT, CHOP−/− controls, and LPS-treated CHOP−/− mice. Results are expressed as a ratio between GRP78 to β-actin and spliced XBP-1 to β-actin. The levels in WT control kidneys are arbitrarily defined as 1. **P < 0.01. ##P < 0.01.

