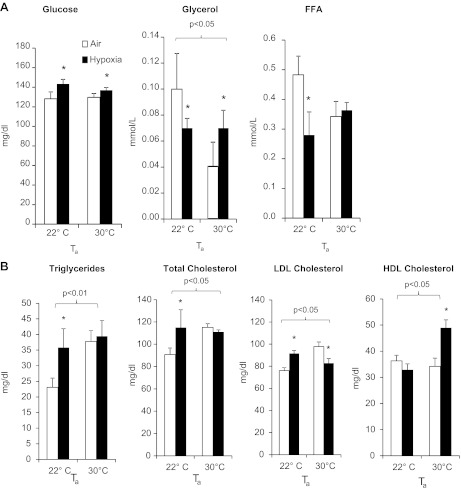
Fig. 3.
Glucose, glycerol, and free fatty acids (FFA) (A) and lipid profile exposed to hypoxia (B) at 22 or 30°C. Values for mice exposed to 21% O2 are shown in open bars, whereas values for mice exposed to 10% O2 are shown in filled bars. *P < 0.05 for effect of hypoxia; bracketed P value for significant effects of Ta is shown. Values are plotted as means ± SE.

