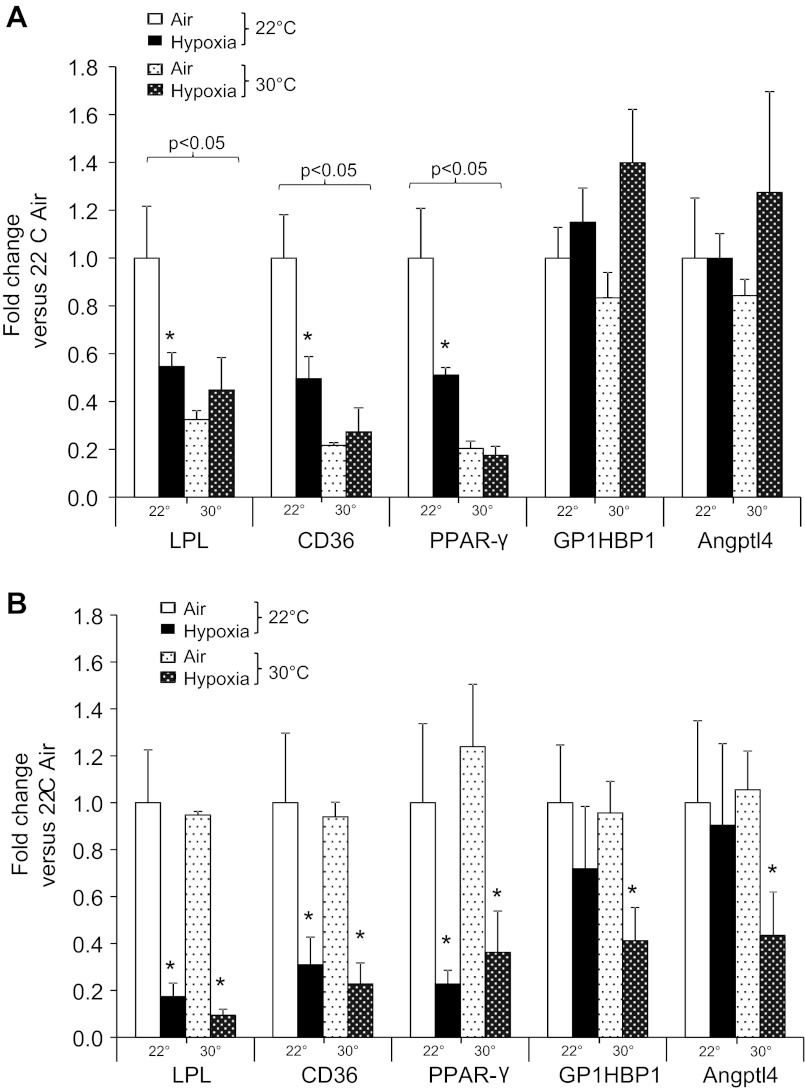
Fig. 8.
Effect of Ta and hypoxia on BAT (A) and WAT gene expression (B). *P < 0.05 for effect of hypoxia; bracketed P values for significant effect of Ta are shown. Values are plotted as means ± SE. PPARγ, peroxisome proliferator-activated receptor-γ; GPIHBP1, glycosylphosphatidylinositol-anchored high-density lipoprotein-binding protein-1; Angptl4, angiopoetin-like protein-4.

