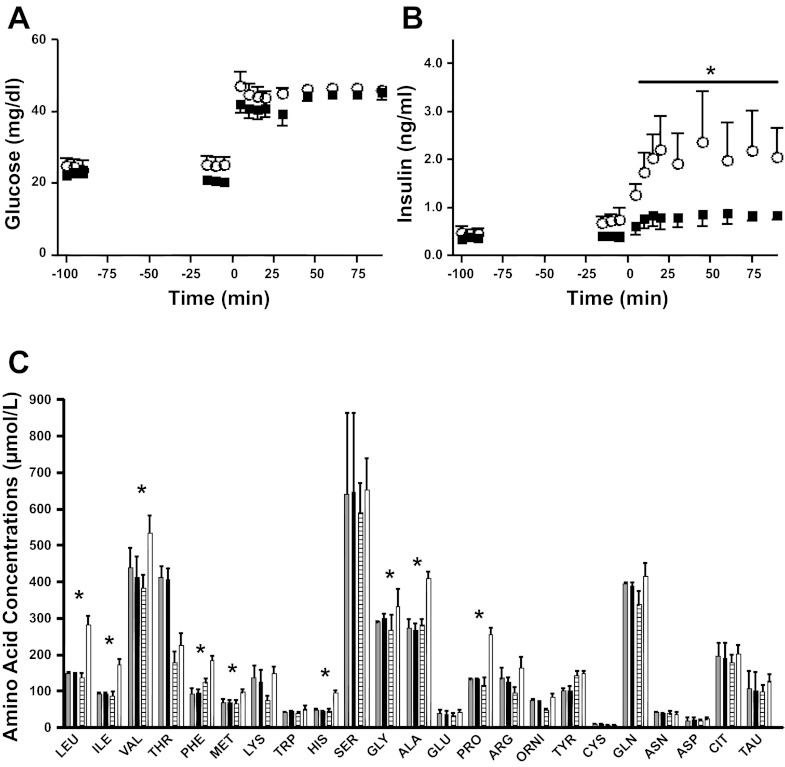
Fig. 8.
Acute AA-potentiated fetal GSIS. A square-wave hyperglycemic clamp was initiated at minute 0 and titrated to achieve a 2-fold increase in glucose concentrations from baseline in both groups. Glucose (A) and insulin (B) were measured throughout. ■, CON group (n = 5); ○, AA group (n = 5). C: gray bars represent baseline CON AA concentrations, and black bars represent the CON AA concentrations at initiation of the hyperglycemic clamp. White striped bars represent baseline AA concentrations, and open bars represent the AA concentrations at initiation of the hyperglycemic clamp. Values are means ± SE. *P < 0.05.

