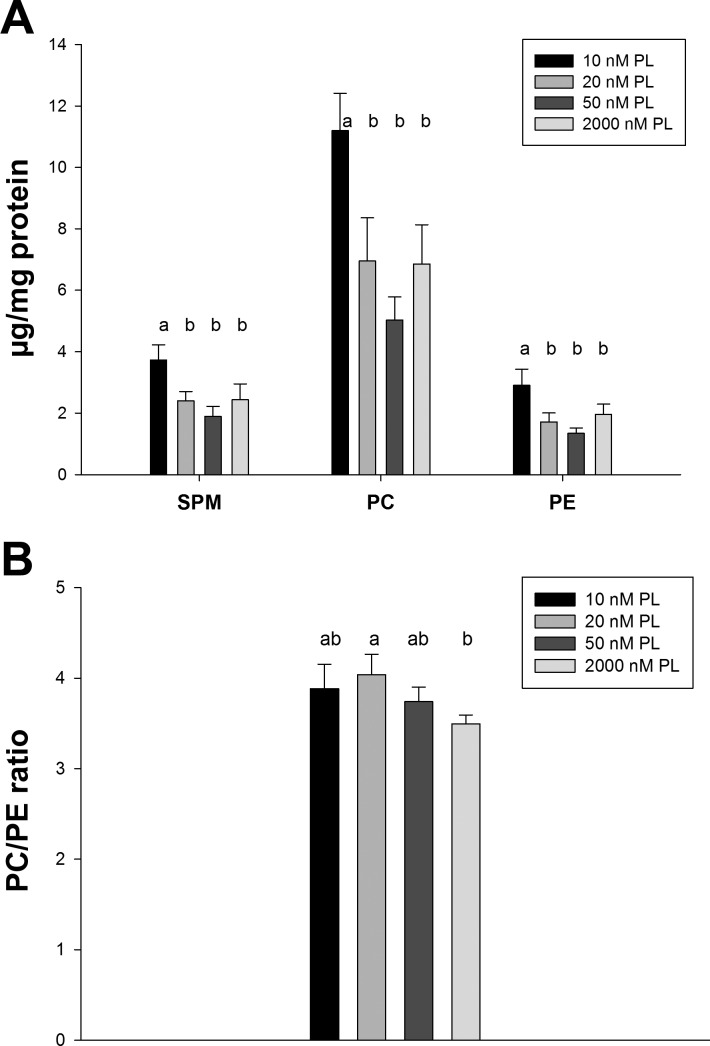
Fig. 6.
Total phosphatidylcholine (PC), phosphatidylethanolamine (PE), and sphingomyelin (SPM) contents in HepG2 cells cultured with different PL concentrations. Data were presented as means ± SD (n = 4). Means of each column without a common letter in the superscript differ significantly (P ≤ 0.01).

