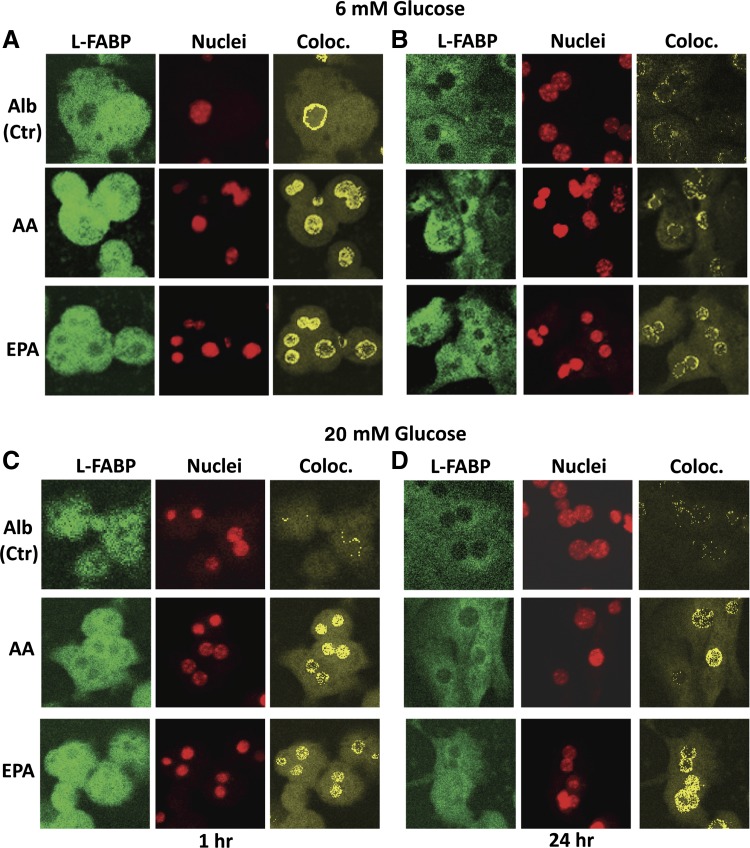
Fig. 7.
Impact of PUFA on L-FABP distribution to hepatocyte nuclei. Primary hepatocytes from WT mice were cultured with glucose (6 or 20 mM) and Alb (40 μM) or Alb in complex with 200 μM AA or EPA as described in materials and methods. After 1 and 24 h incubation, medium was removed and hepatocytes were fixed, labeled with FITC-anti-L-FABP and TO-PRO nuclear stain, and simultaneously imaged through separate photomultipliers (to detect FITC and TO-PRO) by confocal microscopy as described in materials and methods and analyzed similarly as was described earlier (35, 38, 86). Representative confocal fluorescence images of L-FABP (green, first column), nuclei (red, second column), and colocalized pixels (yellow, third column) of hepatocytes are shown for 6 mM glucose (A and B) or 20 mM glucose (C and D) after incubation for 1 h (A and C) or 24 h (B and D). Ctr, control; Coloc., colocalized.

