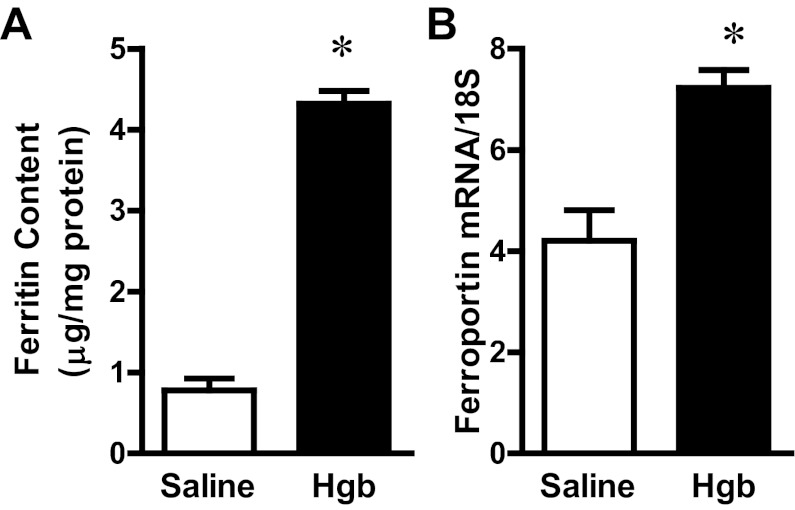
Fig. 4.
Renal ferritin content and ferroportin expression in old mice 1 day after the intravenous administration of hemoglobin. A: ferritin content in kidney lysates from saline-treated mice and Hgb-treated mice was assayed by ELISA and normalized to protein content. B: ferroportin mRNA expression was assessed by quantitative real-time RT-PCR and normalized to 18S rRNA expression. *P < 0.05 vs. saline-treated mice; n = 5 and n = 11 for saline-treated mice and Hgb-treated mice, respectively.

