Fig. 6.

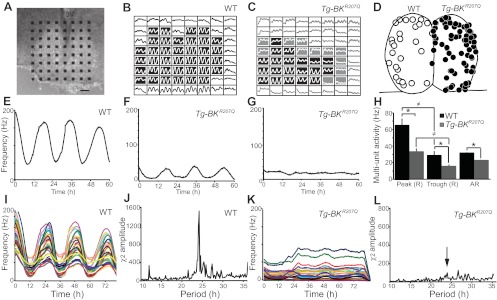
Circadian rhythms in WT and Tg-BKR207Q SCN circuits. A: representative coronal organotypic SCN slice on a 64-electrode probe. 3V, 3rd ventricle. Scale bar = 100 μm. B-C: Multi-unit spontaneous action potential activity on all 64 electrodes for 3 circadian cycles from a WT (B) and Tg-BKR207Q (C) slice. Shaded boxes are within the SCN, black: rhythmic, gray: arrhythmic. Y-axis is optimized for each recording to emphasize rhythmic vs. arrhythmic. D: Locations of arrhythmic recordings from WT (left side, ○, n = 27/229 recordings, 9 slices) and Tg-BKR207Q (right side, ●, n = 74/183 recordings, 7 slices) SCNs. E–G: Activity at a single electrode from a rhythmic WT (E), rhythmic Tg-BKR207Q (F), and arrhythmic Tg-BKR207Q (G) recording. H: average multiunit firing frequency during the peak and trough for rhythmic (R) recordings was different between WT and Tg-BKR207Q (*main effect of genotype, P = 10−3, two-way ANOVA). For both WT Tg-BKR207Q, there was a day vs. night difference in firing (≠main effect of time, P = 10−3, two-way ANOVA). For arrhythmic activity (AR), Tg-BKR207Q firing frequency was also reduced compared with WT (P = 0.007, t-test). WT, n = 9 slices, 202 recordings; Tg-BKR207Q, n = 7, 109. I and K: representative synchronized SCN circuit rhythm from WT (I) and Tg-BKR207Q (K) SCNs. Activity at each electrode is represented by a different color. J and L: representative χ2 periodograms from WT (J) and Tg-BKR207Q (L) SCNs. Arrow, circadian peak.
