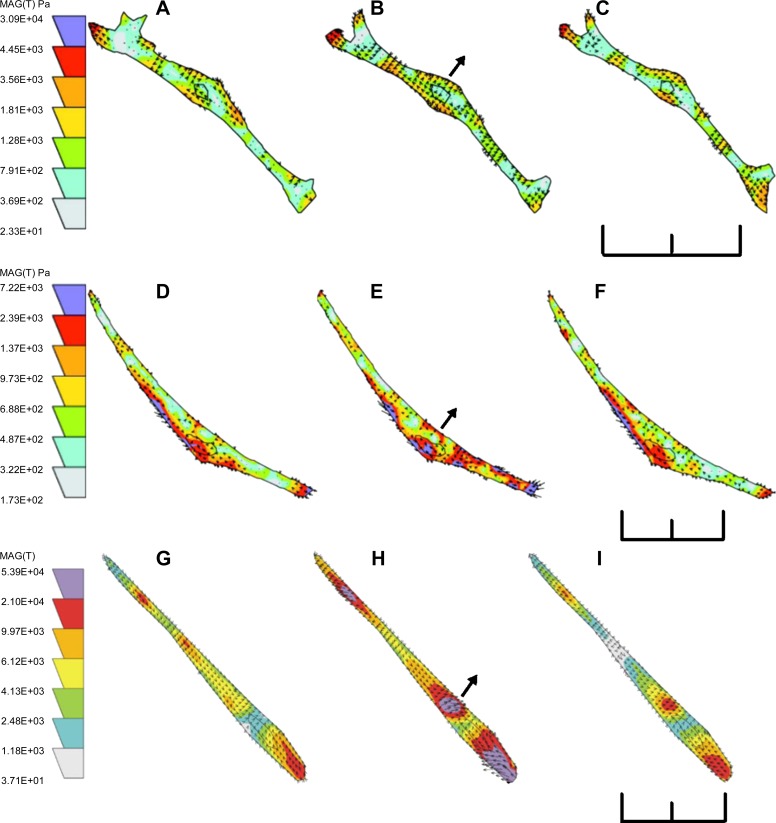
Fig. 2.
Force maps of a renal VSMC pulled by uncoated paramagnetic beads (A, B, and C), LDL-coated paramagnetic beads (D, E, and F), and fibronectin-coated paramagnetic beads (G, H, I). Traction forces were measured before pulling (A, D, and G), 30 s after initiation of pulling (B, E, and H), and 30 s after termination of pulling (C, F, and I). Scale bars = 90 μm. Arrows indicate the direction of pulling force and the position of the electromagnet. Colored scales of cell traction force are in Pascal.

