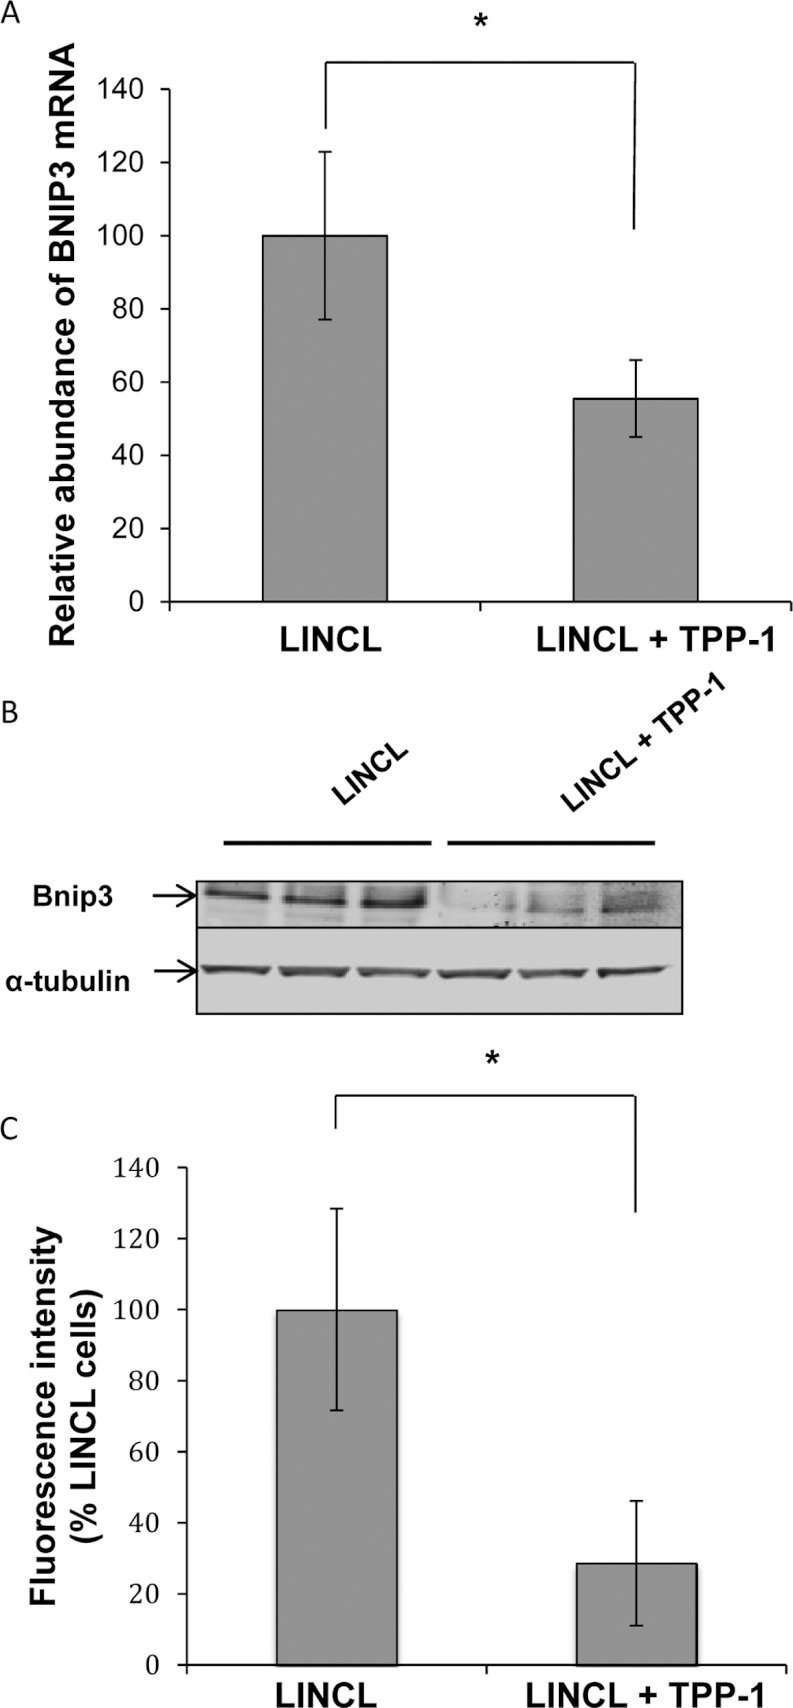
Figure 3. Effects of a TPP-1 deficiency on the expression of BNIP3.
(A) Total RNA was extracted from LINCL cells pre-incubated with (LINCL+TPP-1) or without (LINCL) TPP-1, reverse transcribed and amplified by real-time RT–qPCR in the presence of BNIP3 primers and SYBR green. GAPDH was used as reference gene for data normalization. Results are expressed in percentages of the mRNA abundance determined in LINCL cells and represent means±S.D. (n=3). *: significantly different from LINCL cells with P<0.05 as determined by a Student's t test. (B) The protein abundance of BNIP3 was determined by Western blot analysis performed on 15 μg of clear cell lysates prepared from LINCL cells pre-incubated (LINCL+TPP-1) or not (LINCL) with TPP-1 (n=3). Equal protein loading was controlled by the immunodetection of α-tubulin. (C) Quantification of the Western blot presented in (B). Fluorescence intensity of the band of interest was normalized for α-tubulin and expressed as percentages of LINCL cells. Results are means±S.D. (n=3). *: significantly different from LINCL cells with P<0.05 as determined by a Student's t test.

