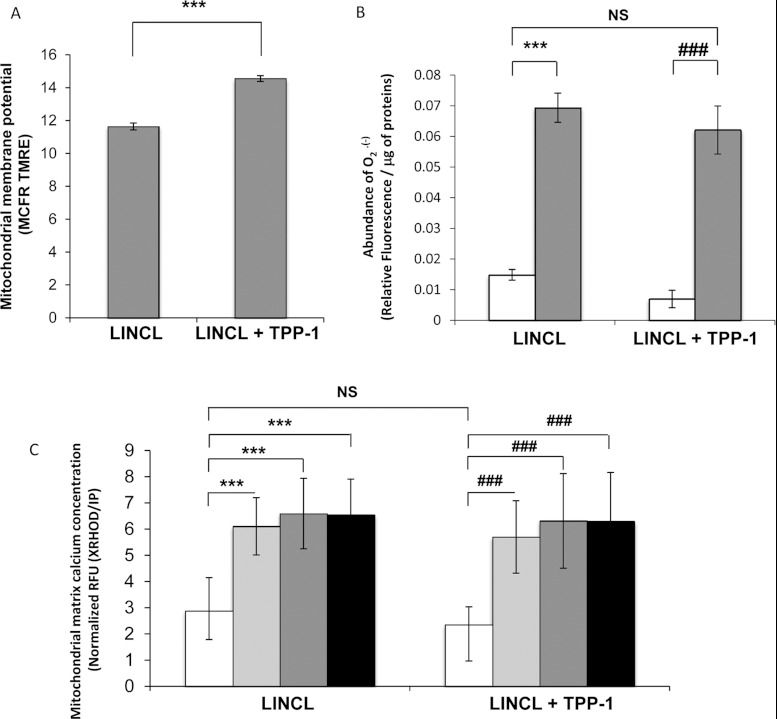
Figure 8. Effects of a TPP-1 deficiency on the mitochondrial membrane potential, mitochondrial matrix calcium concentration and mitochondrial O2•− content.
(A) The mitochondrial membrane potential was analysed in LINCL cells pre-incubated with (LINCL+TPP-1) or without (LINCL) recombinant TPP-1, using the specific mitochondrial membrane potential probe TMRE. Cells were stained or not (to allow autofluorescence determination from cells without dye) with 25 nM TMRE for 30 min and fluorescence was analysed by flow cytometry. Results are expressed as TMRE fluorescence MCFR as means±S.D. (n=3), ***: significantly different from LINCL cells with P<0.001 as determined by a Student's t test. (B) The mitochondrial O2•− content was assessed in LINCL cells pre-incubated with (LINCL+TPP-1) or without (LINCL) TPP-1 using the specific mitochondrial MitoSOX™ Red dye. Cells were stained (white and grey columns) or not (to allow autofluorescence determination from cells without dye) with 10 μM MitoSOX™ Red specific dye for 10 min and fluorescence intensities were measured using a spectrofluorimeter (λexc, 485 nm; λem, 520 nm). As a positive control, cells were incubated for 15 min with 10 μM antimycin A (grey columns) while untreated cells were maintained for 15 min without molecule (white columns). Results were normalized for protein content and expressed in relative fluorescence arbitrary unit/μg of proteins as means±S.D. (n=3). ***, ###: significantly different from untreated LINCL and LINCL+TPP-1 cells, respectively, with P<0.001 as determined by an ANOVA-2 followed by a Holm-Sidak's t test. NS, non-significantly different from LINCL cells. (C) The mitochondrial calcium concentration in LINCL cells pre-incubated with (LINCL+TPP1) or without (LINCL) recombinant TPP-1 was determined using X-Rhod-5F, a specific mitochondrial matrix calcium probe. Cells were stained or not (to allow autofluorescence determination from cells without dye) with 2 μM X-Rhod-5F fluorescent probe for 30 min and fluorescence intensities were measured in a spectrofluorimeter (λexc, 580 nm; λem, 612 nm). To test mitochondrial calcium buffering capacity, cells were incubated with 10 μM ionomycin for 10 min (grey columns), 20 min (dark grey columns) or 30 min (black columns) or left untreated (white columns). Results are expressed as Relative Fluorescence Units (RFU) normalized for DNA content determined by propidium iodide (IP) staining as means±S.D. (n=9). ***, Significantly different from LINCL cells with P<0.001, ###: significantly different from LINCL+TPP-1 cells as determined by a Mann–Whitney Rank Sum test. NS, non-significantly different from LINCL cells.

