
Figure 3. Demographic history of wild boars.
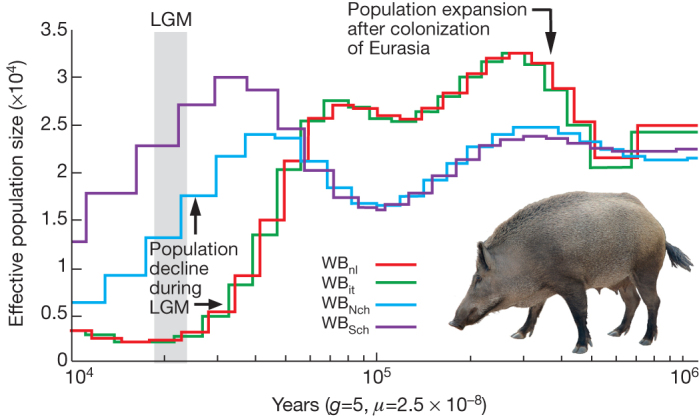
Demographic history was inferred using a hidden Markov model (HMM) approach as implemented in pairwise sequentially Markovian coalescence (PSMC)45. In the absence of known mutation rates for pig, we used the default mutation rate for human (μ) of 2.5 × 10⁻⁸. For the generation time (g) we used an estimate of 5 years. The Last Glacial Maximum (LGM) is highlighted in grey. WBnl, wild boar Netherlands; WBit, wild boar Italy; WBNch, wild boar north China; WBSch, wild boar south China.