
Figure 4. Putative selective sweep region around the ERI2 gene on SSC3.
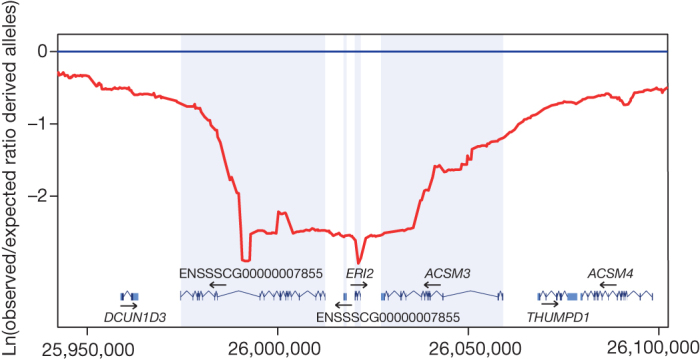
The y axis shows the log-transformed value of the ratio for the observed/expected derived allele frequency using a sliding window at a bin size of 50,000 bp. The x axis shows the position on SSC3 in base pairs.