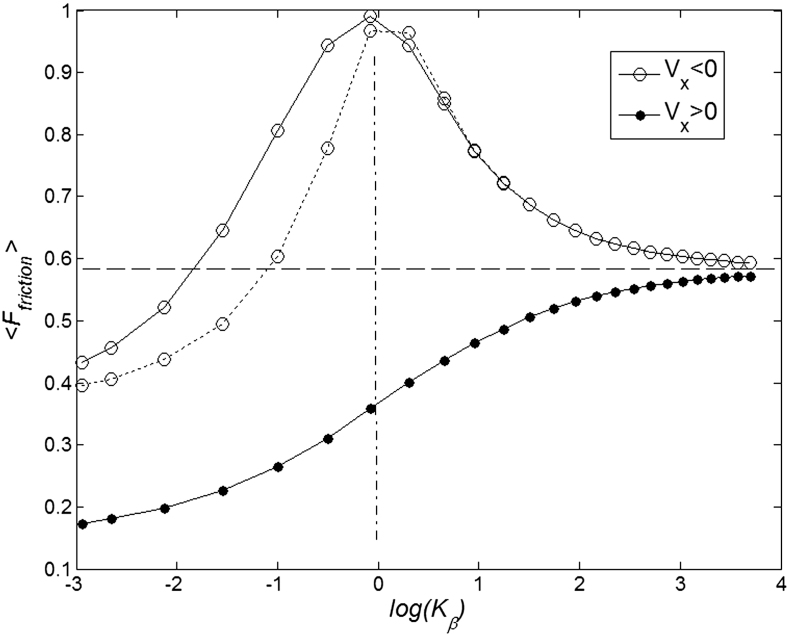
Figure 6. Mean friction forces for fixed positive and negative velocities  accumulated for a few orders of the absolute value
  .
.
Optimal elasticity around at  , which corresponds to the maximal anisotropy of motion, is marked by dash-dotted line. To compare two variants of the model, numerical simulations with
  also was performed (dotted curve).

