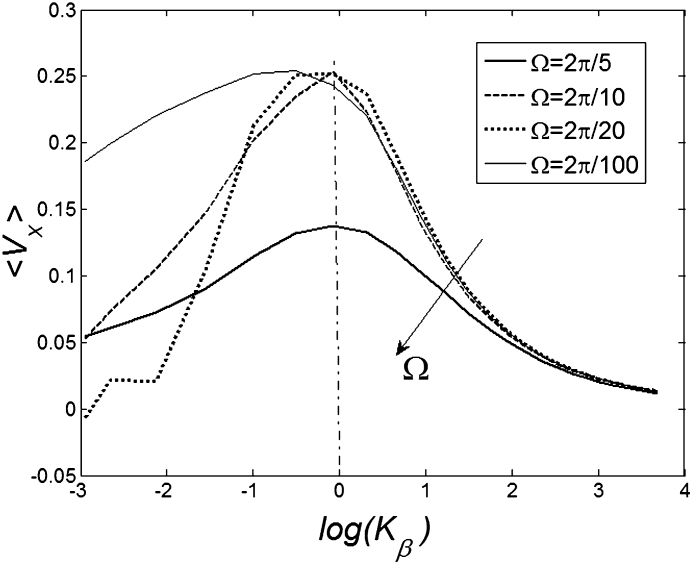
Figure 7. Dependence of mean drift velocity  on the elasticity of the surface
  calculated for some representative frequencies
  .
.
Dot-dashed line corresponds to optimal elasticity  , at which the drift velocity is maximal. The arrow qualitatively marks monotonous shift of the curves
  at frequencies higher than
  . Most of these curves (excluding one example for
  ) are not shown here to do not overload the figure.

