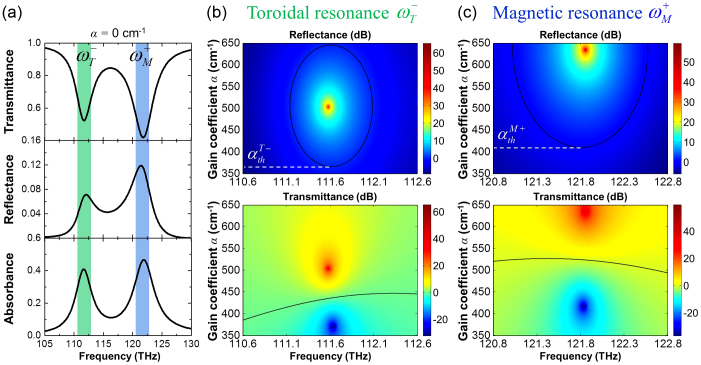
Figure 2. Absorbance, reflectance and transmittance spectra.
(a) Simulated spectral response of the toroidal metamaterial in the case of α = 0 cm−1. The magnetic and toroidal resonances are excited at the higher and lower frequency, respectively. Panels (b) and (c) show transmittance and reflectance spectra as a function of the gain coefficient α in the range from 350 to 650 cm−1 for magnetic and toroidal modes respectively. The intensity of transmittance and reflectance spectra is shown as color in dB scale, and the unity transmittance and reflectance is marked as black solid contour.

