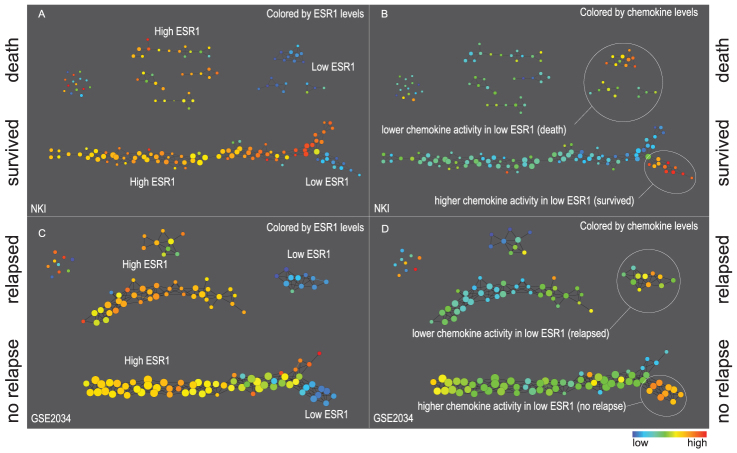
Figure 2. Networks derived from NKI (panels A and B) and GSE2034 (panels C and D).
Two filter functions, L-Infinity centrality and survival or relapse were used to generate the networks. The top half of panels A and B are the networks of patients who didn't survive, the bottom half are the patients who survived. Panels C and D are similar to panels A and B except that one of the filters is relapse instead of survival. Panels A and C are colored by the average expression of the ESR1 gene. Panels B and D are colored by the average expression of the genes in the KEGG chemokine pathway. Metric: Correlation; Lens: L-Infinity Centrality (Resolution 70, Gain 3.0x, Equalized) and Event Death (Resolution 30, Gain 3.0x). Color bar: red: high values, blue: low values.

