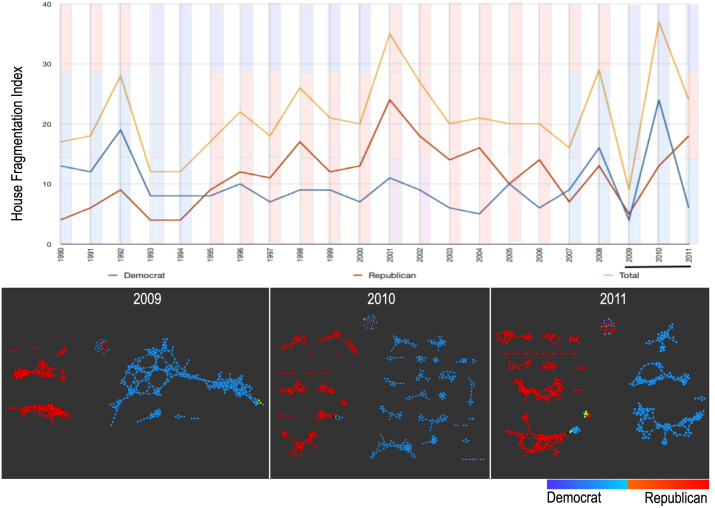
Figure 4. Top panel is the fragmentation index calculated from the number of sub-networks formed each year per political party.
X-axis: 1990–2011. Y-axis: Fragmentation index. Color bars denote, from top to bottom, party of the President, party for the House, party for the Senate (red: republican; blue: democrat; purple: split). The bottom 3 panels are the actual topological networks for the members. Networks are constructed from voting behavior of the member of the house, with an “aye” vote coded as a 1, “abstain” as zero, and “nay” as a -1. Each node contains sets of members. Each panel labeled with the year contains networks constructed from all the members for all the votes of that year. Note high fragmentation in 2010 in both middle panel and in the Fragmentation Index plot (black bar). The distance metric and filters used in the analysis were Pearson correlation and principal and secondary metric SVD. Metric: Correlation; Lens: Principal SVD Value (Resolution 120, Gain 4.5x, Equalized) and Secondary SVD Value (Resolution 120, Gain 4.5x, Equalized). Color: Red: Republican; Blue: Democrats.

