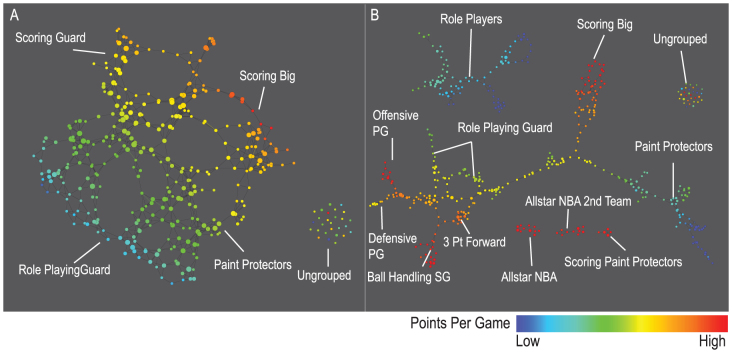
Figure 5. The following map of players was constructed using the principal and secondary SVD filters at two different resolutions.
A) Low resolution map at 20 intervals for each filter B) High resolution map at 30 intervals for each filter. The overlap is such at that each interval overlaps with half of the adjacent intervals, the graphs are colored by points per game, and a variance normalized Euclidean distance metric is applied. Metric: Variance Normalized Euclidean; Lens: Principal SVD Value (Resolution 20, Gain 2.0x, Equalized) and Secondary SVD Value (Resolution 20, Gain 2.0x, Equalized). Color: red: high values, blue: low values.

