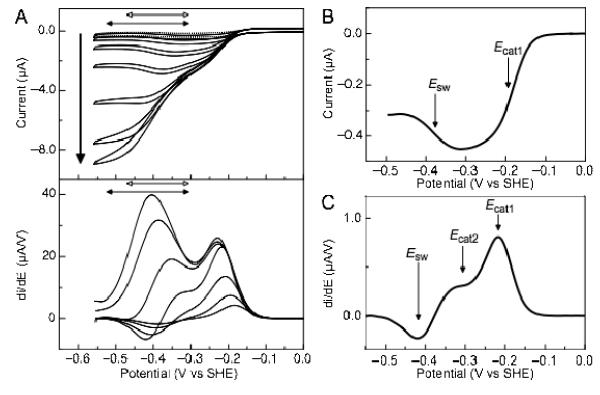
Figure 2.
Current-potential profile of soNrfA nitrite reduction. (A) Cyclic voltammograms of soNrfA in the presence of increasing concentrations of nitrite. Reactions were carried out at 20°C, pH ~8.3, scan rate 10 mV/s, electrode rotation rate 3000 rpm. Bold arrow indicates direction of increasing nitrite concentration (1.4, 5.5, 17, 54, 160, 490, and 1460 μM). Full scans are shown in top panel. Filled horizontal double-headed arrows indicate the potential range where the boost is observed, −300 to −525 mV. Open horizontal double-headed arrows indicate the potential range where the switch is observed, −300 to −470 mV. First derivative of reductive scans of catalytic waves are shown in bottom panel. (B) Baseline-subtracted reductive catalytic wave for soNrfA at 1.37 μM nitrite showing the decrease in activity at potentials below ~ −300 mV. (C) First derivative of reductive catalytic wave for soNrfA at 54.1 μM nitrite showing that three distinct features can be simultaneously observed.

