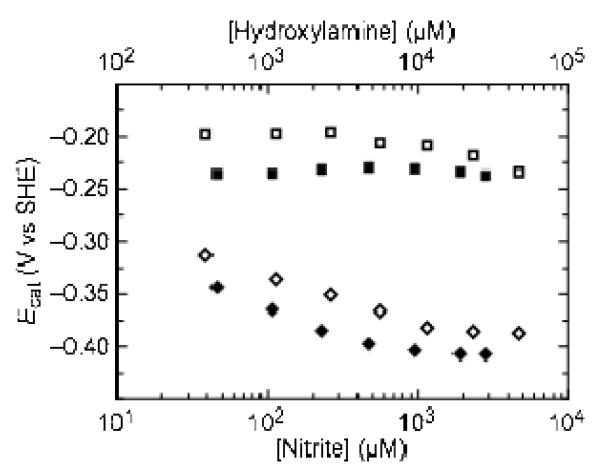
Figure 6.
Variation of the position of Ecat1 (squares) and Ecat2 (diamonds) with the concentration of nitrite (filled symbols) and hydroxylamine (open symbols). Data were collected at pH 8.3, 20°C, 3000 rpm, 20 mV/s, 2 mM CaCl2. Nitrite concentration is plotted on the lower x-axis and hydroxylamine concentration is plotted on the upper x-axis.

