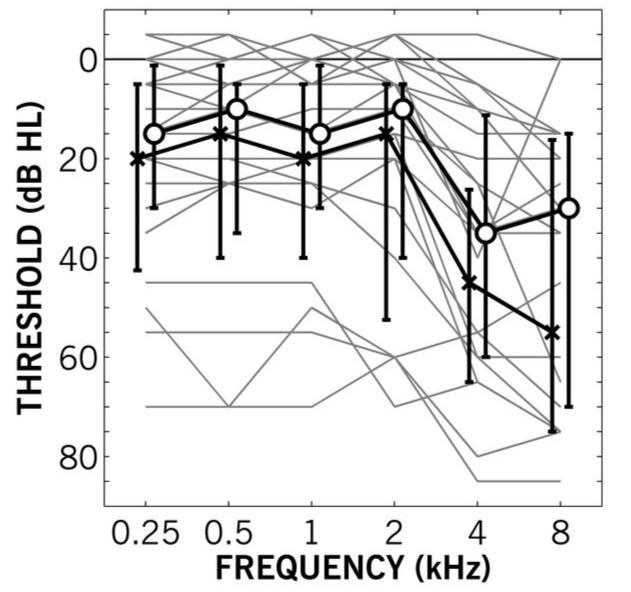
Figure 1.
Pure-tone audiometric thresholds as a function of frequency for Experiment I. Gray lines show individual participant’s better-ear (based on variable pure-tone threshold average) audiogram. Black lines show median thresholds for left (crosses) and right (circles) ears. Error bars show first and third quartile ranges.

