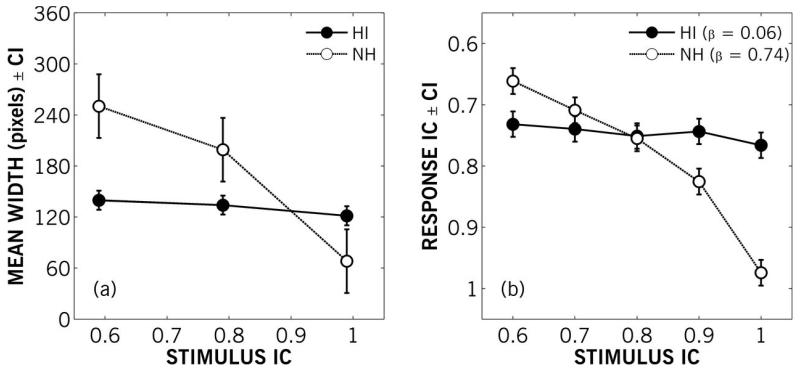
Figure 10.
Left panel (a) shows mean results for Experiment IIIa: mean width in pixels of drawn responses by younger NH and older HI participants as a function of the interaural coherence of 0°-position stimuli. Error bars show 95% within-subject confidence intervals. Right panel (b) shows mean results for Experiment IIIb: mean response IC as a function of stimulus IC for younger NH and older HI participants. Error bars show 95% within-subject confidence intervals. For comparison with panel (a), the ordinate direction has been inverted, so broader images are at the top. Average linear-regression slopes (β) are given for both groups.

