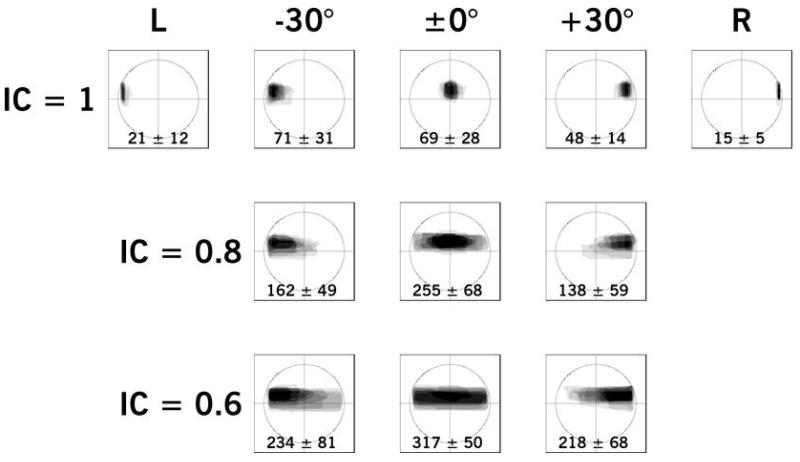
Figure 7.
Example of Experiment III results for a younger NH participant, aged 38 years, BEA of 6.7 dB HL, showing aggregated images as a function of position (horizontal labels) and interaural coherence (vertical labels). Levels of gray indicate the frequency of response for that pixel. The mean and standard deviation of image widths relative to the head width is given at the bottom of each frame.

